Marketing is not run on gut feelings. Especially in 2026, the distance between a successful campaign and a budget write-off is measured in data points. Yet, too many teams are drowning in data but starving for insights. They spend hours downloading CSV files and debating which platform holds the "truth," leaving no time for actual performance measurement or strategic optimization.
This complete guide unpacks the frameworks and operational systems required to build a high-performing marketing analytics engine. We’ll move beyond vanity metrics to explore true digital analytics, data governance, and the measurement frameworks you need to turn raw data into a competitive advantage.
Let’s unpack why data chaos happens and how to fix it.
Key takeaways
- Definition: Marketing analytics is the practice of measuring, managing, and analyzing marketing performance to maximize its effectiveness and optimize return on investment (ROI).
- The maturity model: High-performing teams move past descriptive reporting ("what happened") into predictive analytics and prescriptive action.
- The ROI confidence pyramid: You must build a full marketing analytics stack—from first-party data collection to AI automation—before you can trust your dashboards.
- The math matters: Knowing the exact formulas for CAC, CLV, and ROAS is non-negotiable.
- The Hurree edge: Centralizing scattered data sources into a unified intelligence layer is the only way to avoid siloed reporting and see the full picture.
What is marketing analytics?
At its most fundamental level, marketing analytics is the practice of using data to evaluate the performance and efficiency of marketing activities. It involves gathering raw data from across your entire digital footprint—social media, email platforms, SEO tools, paid advertising networks, and CRM systems—and consolidating it to identify patterns, trends, and financial outcomes.
While general business intelligence looks at the overall macroeconomic health of a company, marketing analytics zooms in specifically on the customer journey, market targeting, and the efficiency of the revenue funnel. It exists to answer critical, high-stakes questions like:
- Which specific channels are driving the highest quality, highest-retention leads?
- Where exactly are we losing potential customers in the conversion funnel, and what is the financial cost of that drop-off?
- If we reallocate $50,000 from Meta Ads to Google Search, how will it affect our bottom-line revenue next quarter?
In 2026, marketing analytics has evolved far beyond retrospective, end-of-month reporting. Driven by the integration of AI marketing analytics and real-time campaign analytics, it is now a forward-looking, highly predictive discipline.
Why marketing analytics matters (the operational reality)
For marketing teams and agencies, deep analytics isn't just about "proving" that you worked hard; it's about accountability, agility, and survival.
For in-house marketing teams:
Without rigorous analytics, you are flying blind. You might see that overall company revenue is up, but without knowing why, you cannot replicate or scale the success. Marketing reporting allows marketing leaders to transition from being viewed as a "cost center" (a department that spends money) to a "profit center" (a department that generates measurable wealth) in the eyes of the CFO. It provides the empirical evidence needed to secure larger budgets, defend your strategy during board reviews, and pivot quickly when a campaign underperforms.
For marketing agencies:
Client retention is built entirely on trust and transparency. Agencies that provide vague reports based on "vanity metrics" are the first to be cut when client budgets tighten. Conversely, agencies that provide deep insights into client retention metrics and clear, undeniable ROI modeling become indispensable strategic partners. Analytics is how an agency proves it is an investment, not an expense.
The marketing analytics maturity model
To build a comprehensive strategy, you must first understand where your team currently sits on the analytics maturity curve. Most organizations get stuck at Level 1 or 2, but the true commercial advantages are found at Levels 3 and 4.
Descriptive analytics: "What happened?"
This is the baseline standard for most businesses. It relies on historical data to describe past events.
- The output: Monthly reports showing total website traffic, ad impressions, email open rates, and total spend.
- The limitation: It tells you that traffic dropped by 20% last month, but offers absolutely no insight into why it dropped or what you should do about it.
Diagnostic analytics: "Why did it happen?"
At this level, analysts begin digging deeper into the data to find correlations and isolate root causes. It involves comparing variables and segmenting data.
- The output: Discovering that the 20% traffic drop was isolated entirely to organic mobile search, specifically on product pages, following a recent core algorithm update.
- The value: It identifies the exact location of a problem or success, allowing for targeted tactical fixes.
Predictive analytics: "What will happen?"
This is where modern marketing teams separate themselves from the pack. Predictive analytics uses historical data trends and machine learning algorithms to forecast future outcomes.
- The output: Forecasting that, based on current marketing conversion rates and seasonal search volume, the upcoming Q3 campaign will likely fall 15% short of its lead generation target.
- The value: It allows you to anticipate market shifts and correct your course before you miss your targets.
Prescriptive analytics: "How can we make it happen?"
The highest form of analytics maturity. Prescriptive analytics doesn't just predict the future; it suggests specific, data-backed actions to manipulate that future to your advantage.
The output: The system recommends reallocating 30% of the Q3 budget away from top-of-funnel display ads and moving it into high-intent search terms and remarketing workflows to close the forecasted 15% gap.
The Hurree framework: The ROI confidence pyramid
Most guides jump straight into data visualization. But a dashboard is just a reflection of your underlying operations. To build true measurement confidence, we use The ROI confidence pyramid, a four-layer marketing analytics framework:
- Data collection & first-party data: The foundation. Moving away from third-party cookies and ensuring you capture clean, compliant first-party data directly from your users.
- Data Governance & quality: Establishing strict taxonomies, standardized naming conventions, and defining your CRM as the absolute single source of truth.
- Attribution & Customer journey analytics: Mapping the touchpoints. Using advanced attribution to understand how your campaigns interact and drive pipeline velocity.
- Decision making & automation: The peak of the pyramid. Using prescriptive insights and marketing intelligence to automatically reallocate budget and scale winners.
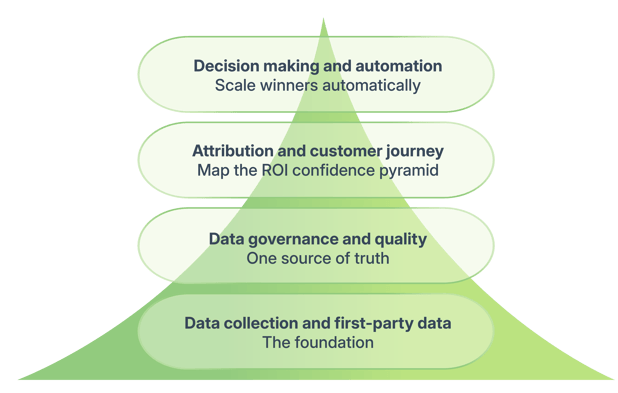
Without the bottom two layers, your dashboards at the top are just beautifully formatted lies.
The mathematics of marketing: Essential KPIs for 2026
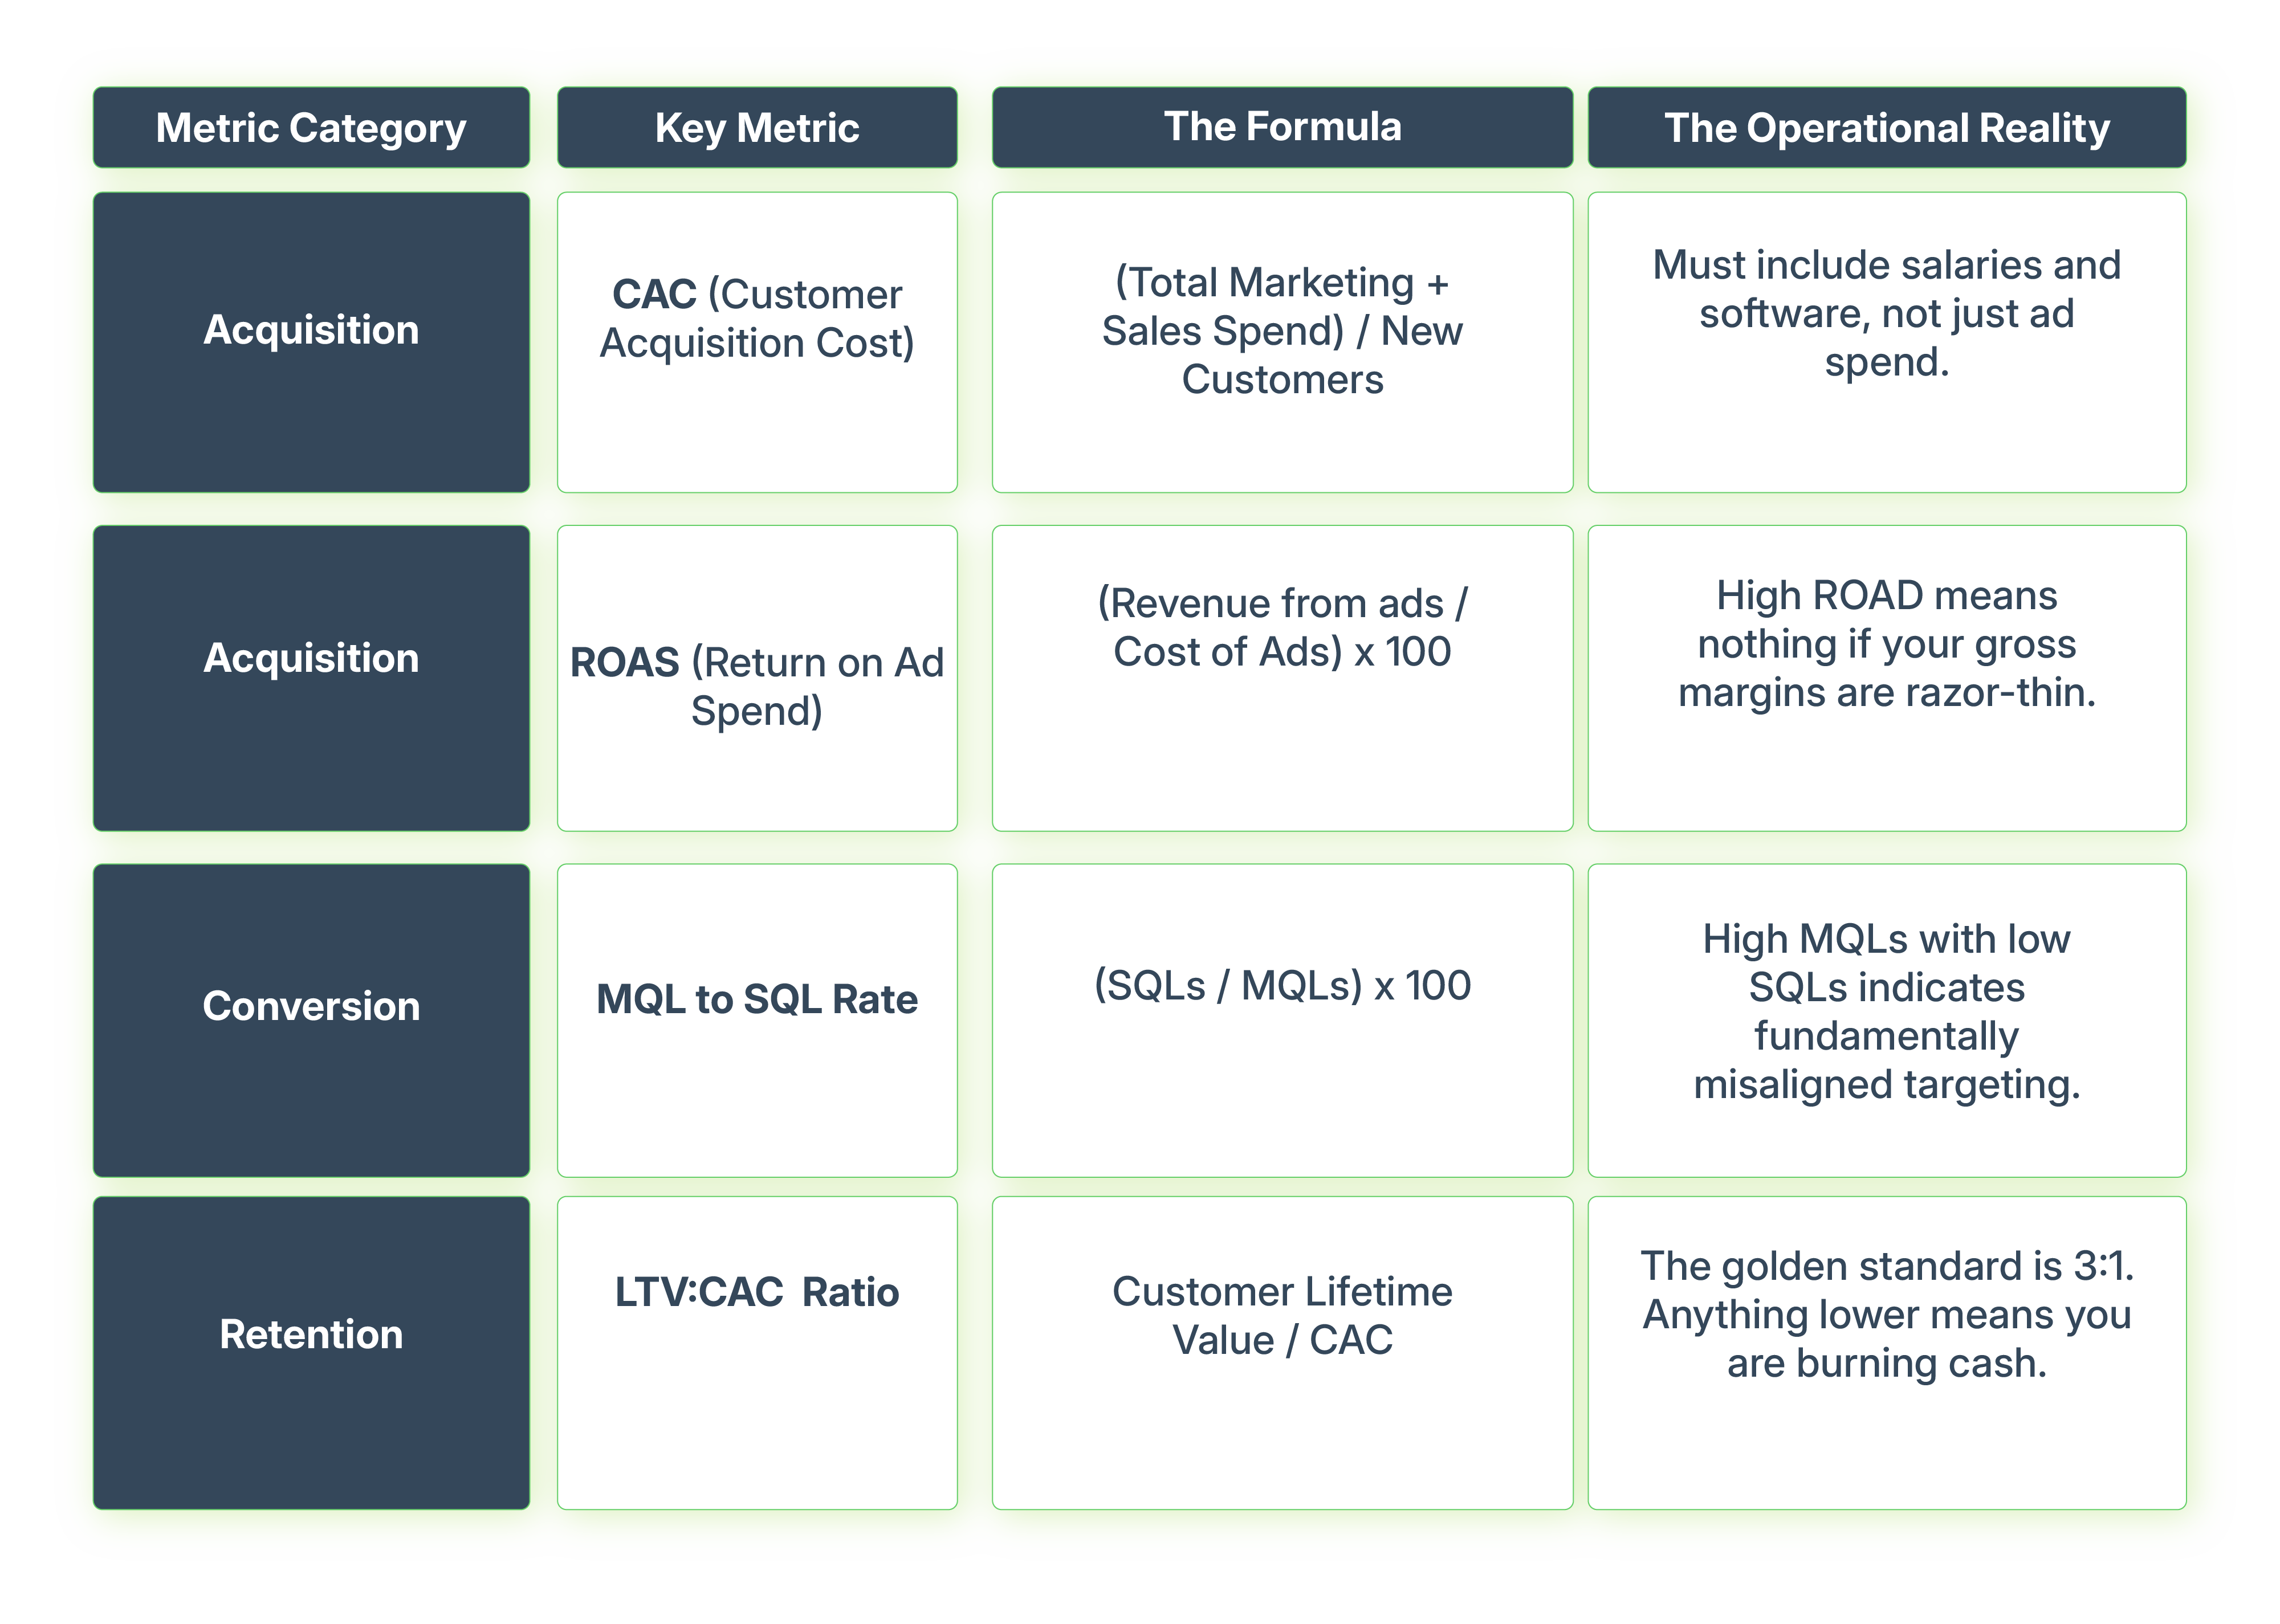
You cannot manage what you do not accurately measure. To build a high-performing ecosystem, you need to focus on core financial marketing KPIs and understand exactly how to calculate them.
Below is a breakdown of the critical metrics every modern marketer must track:
Advanced Attribution: Solving the "why" in 2026
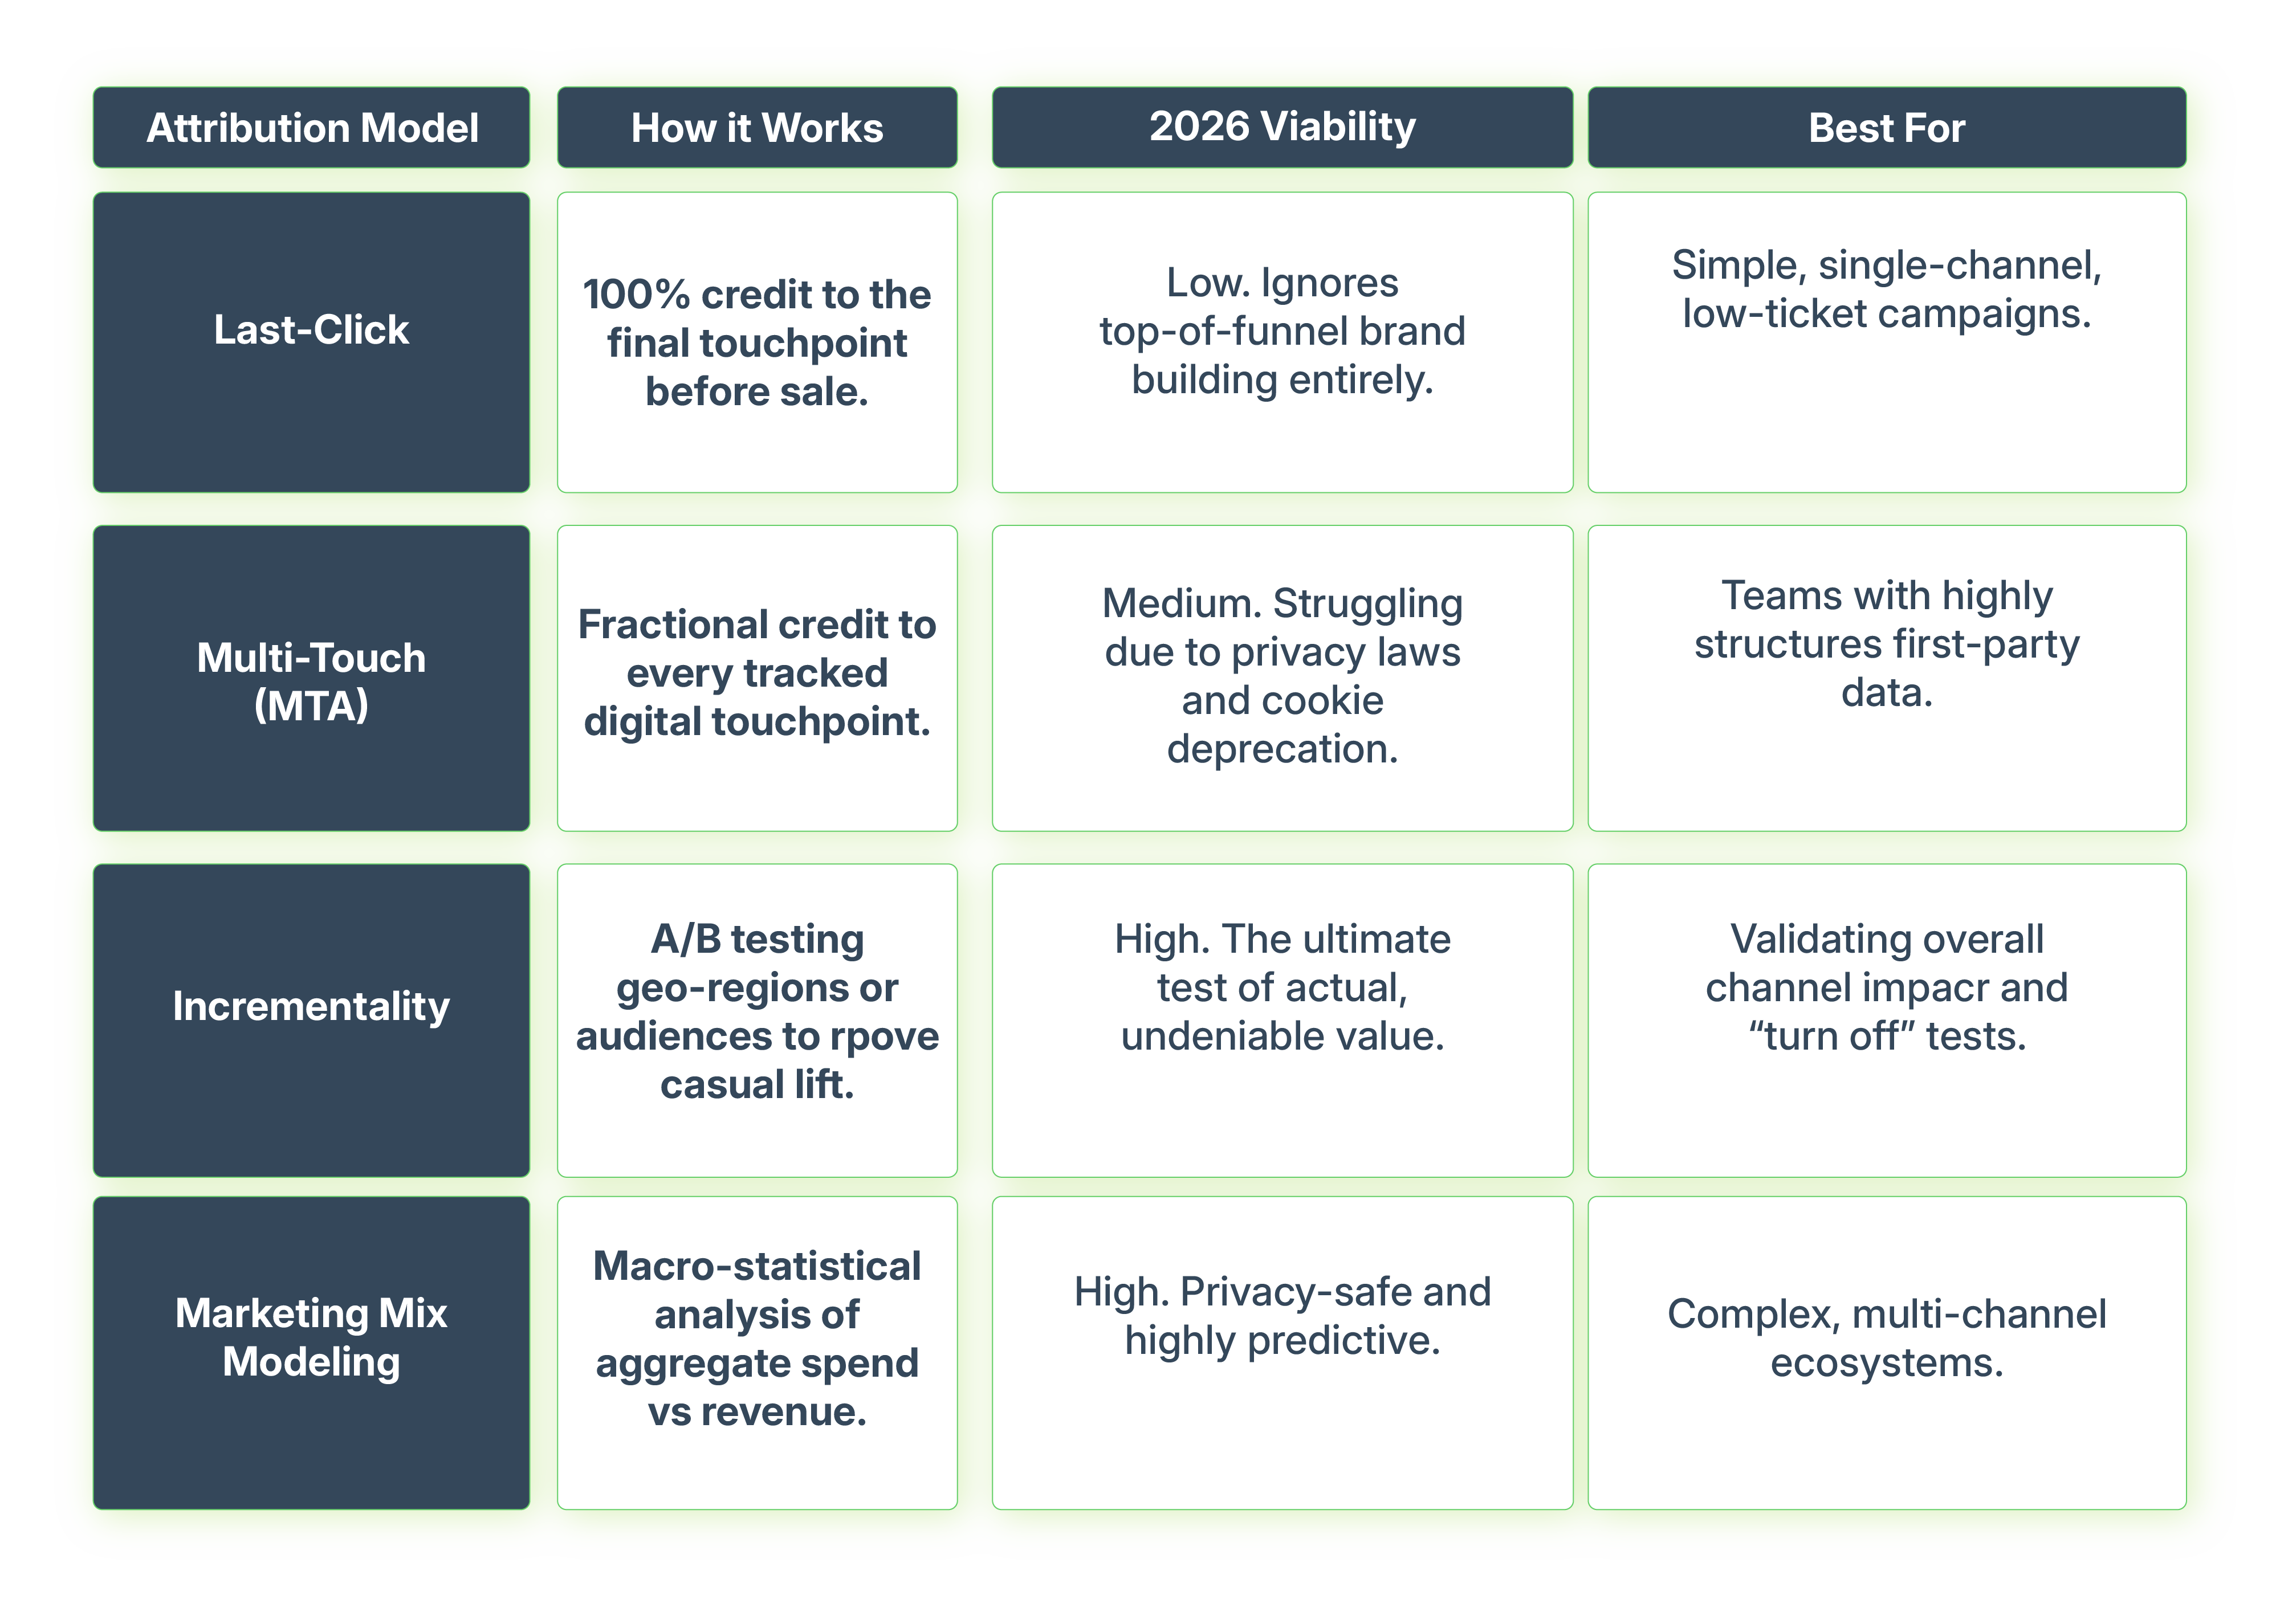
One of the hardest parts of marketing measurement is marketing attribution. If a B2B buyer sees a LinkedIn ad in January, reads a blog post in February, listens to your podcast in March, and then clicks a branded Google Search ad to buy in April—who gets the credit for that sale?

In 2026, relying on basic "Last-Click Attribution" is a dangerous mistake that inevitably leads to budget being stripped from awareness channels, crippling future growth. To get a true picture, sophisticated teams are moving toward advanced models:
The framework: Data governance & taxonomy
Before you can build beautiful dashboards or run predictive models, you must master the operational groundwork. A successful analytics framework is built on rigorous data governance.
Standardize your UTM parameters: UTM parameters are tags added to the end of your URLs that tell your analytics software exactly where traffic came from. If one team member uses utm_source=Facebook and another uses utm_source=FB_Ads, your data will split into two different, confusing buckets.
The fix: Create a rigid, company-wide spreadsheet detailing exact naming conventions for sources, mediums, and campaign names. Enforce it ruthlessly.
Define "truth" across platforms: Meta Ads will always claim it drove more conversions than Google Analytics says it did. This is because platforms use different attribution windows (e.g., Meta takes credit if someone views an ad and buys 7 days later).
The fix: You must declare a single "source of truth." For most companies, this is their CRM (like Salesforce or HubSpot). If the revenue isn't in the CRM, it didn't happen, regardless of what the ad platform dashboard claims.
The Hurree insight pattern: Common analytics mistakes
Even with the right metrics and taxonomy, operational blind spots can derail your strategy.
Mistake: Confusing correlation with causation
- Operational problem: You observe that website traffic and product sales both spiked in November. You assume your new content marketing campaign caused the sales spike.
- Big-picture consequence: You allocate double the budget to content marketing for Q1, but sales plummet.
- Why it’s overlooked: Humans are deeply wired to find patterns. You failed to realize that November is naturally your busiest month due to Black Friday, meaning the sales would have happened regardless of the content campaign.
- The fix: Always use diagnostic analytics and historical year-over-year comparisons to isolate variables.
Mistake: Siloed data leading to double counting
- Operational problem: The social team reports 50 conversions from LinkedIn. The search team reports 50 conversions from Google Ads. The CEO expects 100 new customers, but the CRM only shows 60.
- Big-picture consequence: Leadership loses complete faith in marketing reports, viewing them as fabricated or inflated. Budgets are subsequently slashed.
- Why it’s overlooked: Both ad platforms are taking 100% credit for the same user who clicked a LinkedIn ad on Tuesday and a Google ad on Thursday.
- The fix: Rely on CRM data and incrementality testing to de-duplicate conversions.
Strategic takeaways for marketing leaders
To turn this guide into action, follow these immediate steps:
- Audit your tech stack: If you are using more than five disjointed tools to answer a single question about ROI, your system is too complex. Simplify and integrate.
- Move beyond retrospective reporting: Challenge your analysts to stop presenting "what happened" and start presenting "what this means we should do next week."
- Build a Single pane of glass: Invest in centralized marketing dashboards so your entire team is looking at the exact same numbers.
- Enforce taxonomy rules: Stop the data chaos at the source. Implement strict UTM and naming conventions today.
Hurree: The intelligence layer for modern marketing
Everything we've covered sounds straightforward on paper. In reality, most marketing teams fail because the data lives in 15 disconnected systems. You cannot run advanced campaign analytics when your ad spend is stuck in Meta, and your revenue is trapped in Salesforce.
The most significant barrier to mastering marketing analytics isn't a lack of data; it is a profound lack of clarity.
Your data is scattered across dozens of platforms, hidden in departmental silos, and trapped in static spreadsheets that are out of date the very moment you save them. You cannot make agile, predictive decisions when you are spending hours just trying to format CSV files.
Hurree is the unifying analytics intelligence layer that solves this.
By centralizing your scattered data sources into one environment, Hurree allows you to step out of the chaos and into control. We provide:
- Up-to-date visibility: Build unified dashboards that display your true, de-duplicated marketing ROI across every channel, instantly.
- Automated insights: Stop hunting for anomalies. Our AI Analyst constantly monitors your data, proactively identifying KPI deviations and risk signals before they become board-level crises.
- Seamless collaboration: Create complete transparency across internal teams and agency clients with shared views that ensure everyone is looking at the same, unarguable source of truth.
- No-code connectivity: Connect your entire stack in minutes with our library of pre-built connectors for every major marketing, CRM, and finance tool on the market.
Don't wait for a budget leak or a missed target to tell you your strategy isn't working. Take total control of your data and turn visibility into your greatest competitive advantage.

FAQs: Marketing analytics
What are the 4 types of marketing analytics?
The four evolutionary types are descriptive (what happened in the past), diagnostic (why it happened), predictive (what is likely to happen next), and prescriptive (how to manipulate the outcome).
How do I start with marketing analytics?
Begin by clearly defining your core business goals, establishing a strict UTM taxonomy for clean data collection, auditing your current tracking setups, and implementing a centralization tool like Hurree to visualize your full-funnel performance.
What is the difference between marketing analytics and marketing intelligence?
While often used interchangeably, analytics usually refers to the quantitative measurement of your own internal campaigns and data. Marketing intelligence is broader; it encompasses external factors like competitor analysis, market trends, and industry benchmarks.
What is a digital marketing strategy in the context of analytics?
A digital marketing strategy is the overarching plan of action designed to achieve a specific business goal. Analytics is the feedback loop that measures the success of that strategy, allowing you to iterate, reallocate budget, and optimize the tactics used within the plan.
Is Google Analytics enough for my business?
While GA4 is an incredibly powerful tool for understanding website behavior, it fundamentally lacks the cross-channel context needed for a complete view. It cannot easily factor in your CRM revenue, your total ad spend across non-Google platforms, or your operational costs. To see true ROI, you need an integration layer to blend GA4 data with your broader business systems.


Share this

How To Get Started With B2B SaaS Marketing

Measuring Content Marketing Success: Essential Metrics to Track