What is a Key Performance Indicator (KPI)?
Every business wants to be successful and to do that, it’s important to set and achieve goals. Sounds pretty obvious, right? But, when working towards a goal, it can often be difficult to see what progress has actually been made and how far away the overall target is. That’s where KPIs come in.
What is a KPI?
KPI stands for key performance indicator and is a quantifiable measurement used to assess the progress and performance of a given target within a company. At its highest level, an organisation can have KPIs that assess the entire company's performance, or on a lower level, there can be more specific KPIs that examine the effectiveness and success of specific teams, departments or individuals. They can apply to any element of your business, whether it’s marketing, customer services, sales, employee satisfaction or overall financial health.
KPI meaning vs metrics meaning
You may have heard the term metrics used in business before. While these are useful, they are not quite the same thing as KPIs. Key performance indicators and metrics are similar and can be related, but they serve a different function:
- KPIs measure progress towards specific goals, usually with timeframes and targets. The answer is in the name, they indicate your performance against an important business outcome in a way that supports your strategy and help teams focus on the most important aspects needed to reach long-term objectives.
- Example: Sales pipeline growth, lead to session ratio, MQL to SQP conversion rate, etc.
- Metrics are a quantifiable measure used to track progress and evaluate success. Metrics are often more general and while they are linked loosely to specific goals and targets, they aren't the most important values to keep track of when assessing where you are in relation to your overall goal.
- Example: Website traffic, bounce rate, leads generated, etc.

Think about it this way, every KPI is a metric but not every metric is a KPI.
KPIs and metrics work together. KPIs are vital to the success of all organisations and serve as a signpost to help guide a company to its goals. For a metric to be a KPI, it must have a specific target, a timeframe and be linked to a key business objective. A KPI will be made up of a variety of different metrics that gives you a full picture of progress towards a goal.
Why are KPIs important?
“If you don’t know where you are going, you’ll end up someplace else”
-Yogi Berra
Have you ever tried running a race with a blindfold on, or steering a ship without a rudder? Probably not, but that’s how you could imagine what trying to achieve your goals with no set KPIs could be like. Whether it’s company-wide, departmental, or on a personal level, setting KPIs will help to provide focus and direction.
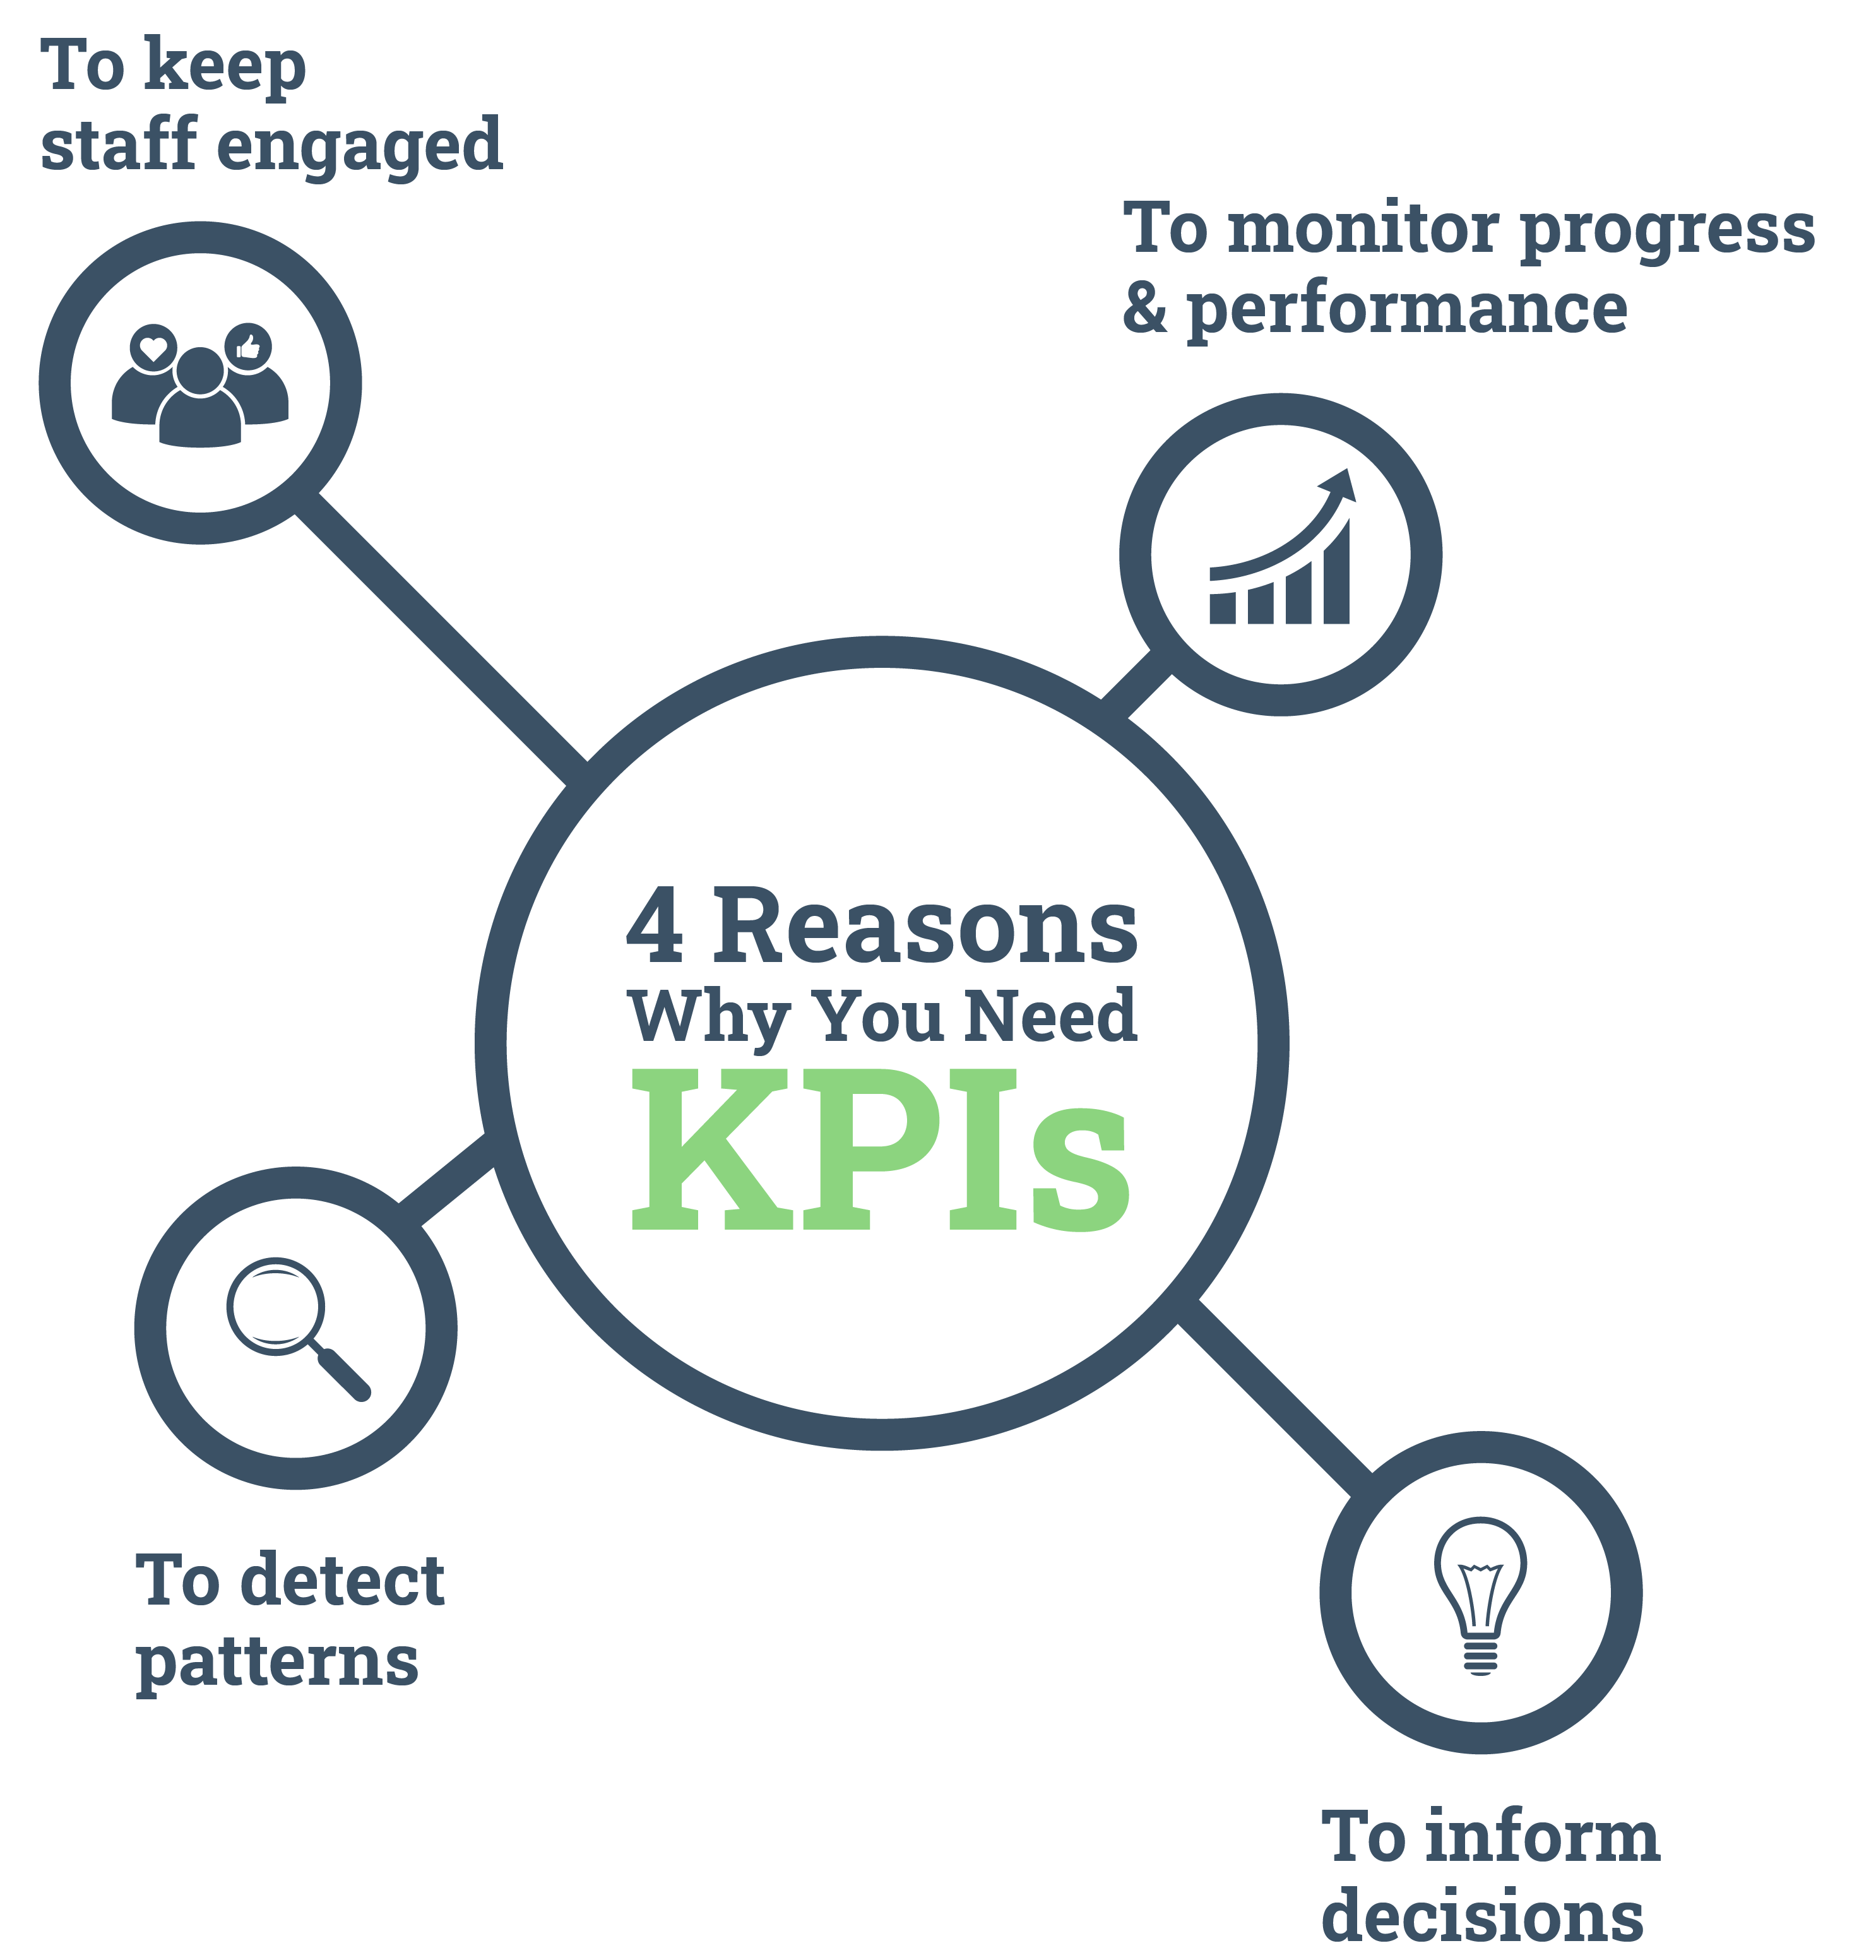
Let’s take a look at some of the key reasons why KPIs are important:
-
Keep staff engaged and on track
It’s no secret that the people within an organisation are essential to the success of the business. Hiring the right people is the first step, but ensuring those people are engaged and moving in the same direction is also vital. KPIs help to unify teams to work towards a common goal, as well as track progress on an individual level, and acknowledge an employee's efforts. When people feel responsible for hitting the targets set by the KPIs, they are more likely to push themselves and receive more satisfaction from a job well done. KPIs can also act as an incentive or motivation to drum up some competitive rivalry between team members, which again helps to engage them and keep them on track.
-
To monitor progress and overall company health
Just like a doctor checks a patient's vital signs as an overall indicator of health, KPIs can be used to give an objective and realistic way to view how your organisation is performing. These can range depending on the type of business but could include metrics such as revenue, costs, gross profit margin, net profit margin, growth, number of clients or employees. By regularly reviewing your KPIs, it will be easier to see when you’re on track or in danger of missing a target, allowing you to make systematic adjustments so that you don’t resort to making frantic changes at the end of each month.
-
Allow you to make decisions
KPIs are extremely insightful as they can be used to effectively inform and shape key decisions and business strategies. By considering KPIs, senior leaders and management will have real data points that can be used to help in decision-making, rather than making decisions based on their intuition or gut feeling. KPIs however don’t work in isolation. A single KPI can be the trigger that a decision needs to be made, but taking other metrics into account will help to guide the outcome of the decision.
-
To detect patterns over time
If you measure the same KPIs monthly or quarterly, you will most likely start to detect patterns and trends within the data. This will help you predict when you might experience your slowest or busiest periods so you can best shape your strategy during those times. For example, if you know historically when your quietest month is likely to be, you can use that time to schedule training or system updates. Likewise, if you know there is a busy month approaching, you can use the downtime to prepare.

Types of KPIs
If you’ve read this far, you probably have a fair idea of what a KPI is and why it is important to an organisation. You aren’t alone if you are currently of the mindset that a KPI is a purely numeric value. While that is true for many, it’s important to think of KPIs as measurements of performance that often go beyond a number.
To get a complete understanding of the performance and progress of your company, there 11 types of KPIs that should be considered:
These are probably the most straightforward KPIs and are measured purely in numerical terms. For example, the average order value of your customers’ basket or how many new marketing leads you have acquired in a certain time frame. Quantitative KPIs can be broken down into two further categories: continuous and discrete.
- Continuous indicators can take any value (including decimals) and can include measurements like miles travelled for a shipping business or time spent per call for a call centre.
- Discrete KPIs are whole numbers and generally count factors such as complaints, accidents, new customers, pounds spent etc.
2. Qualitative indicators
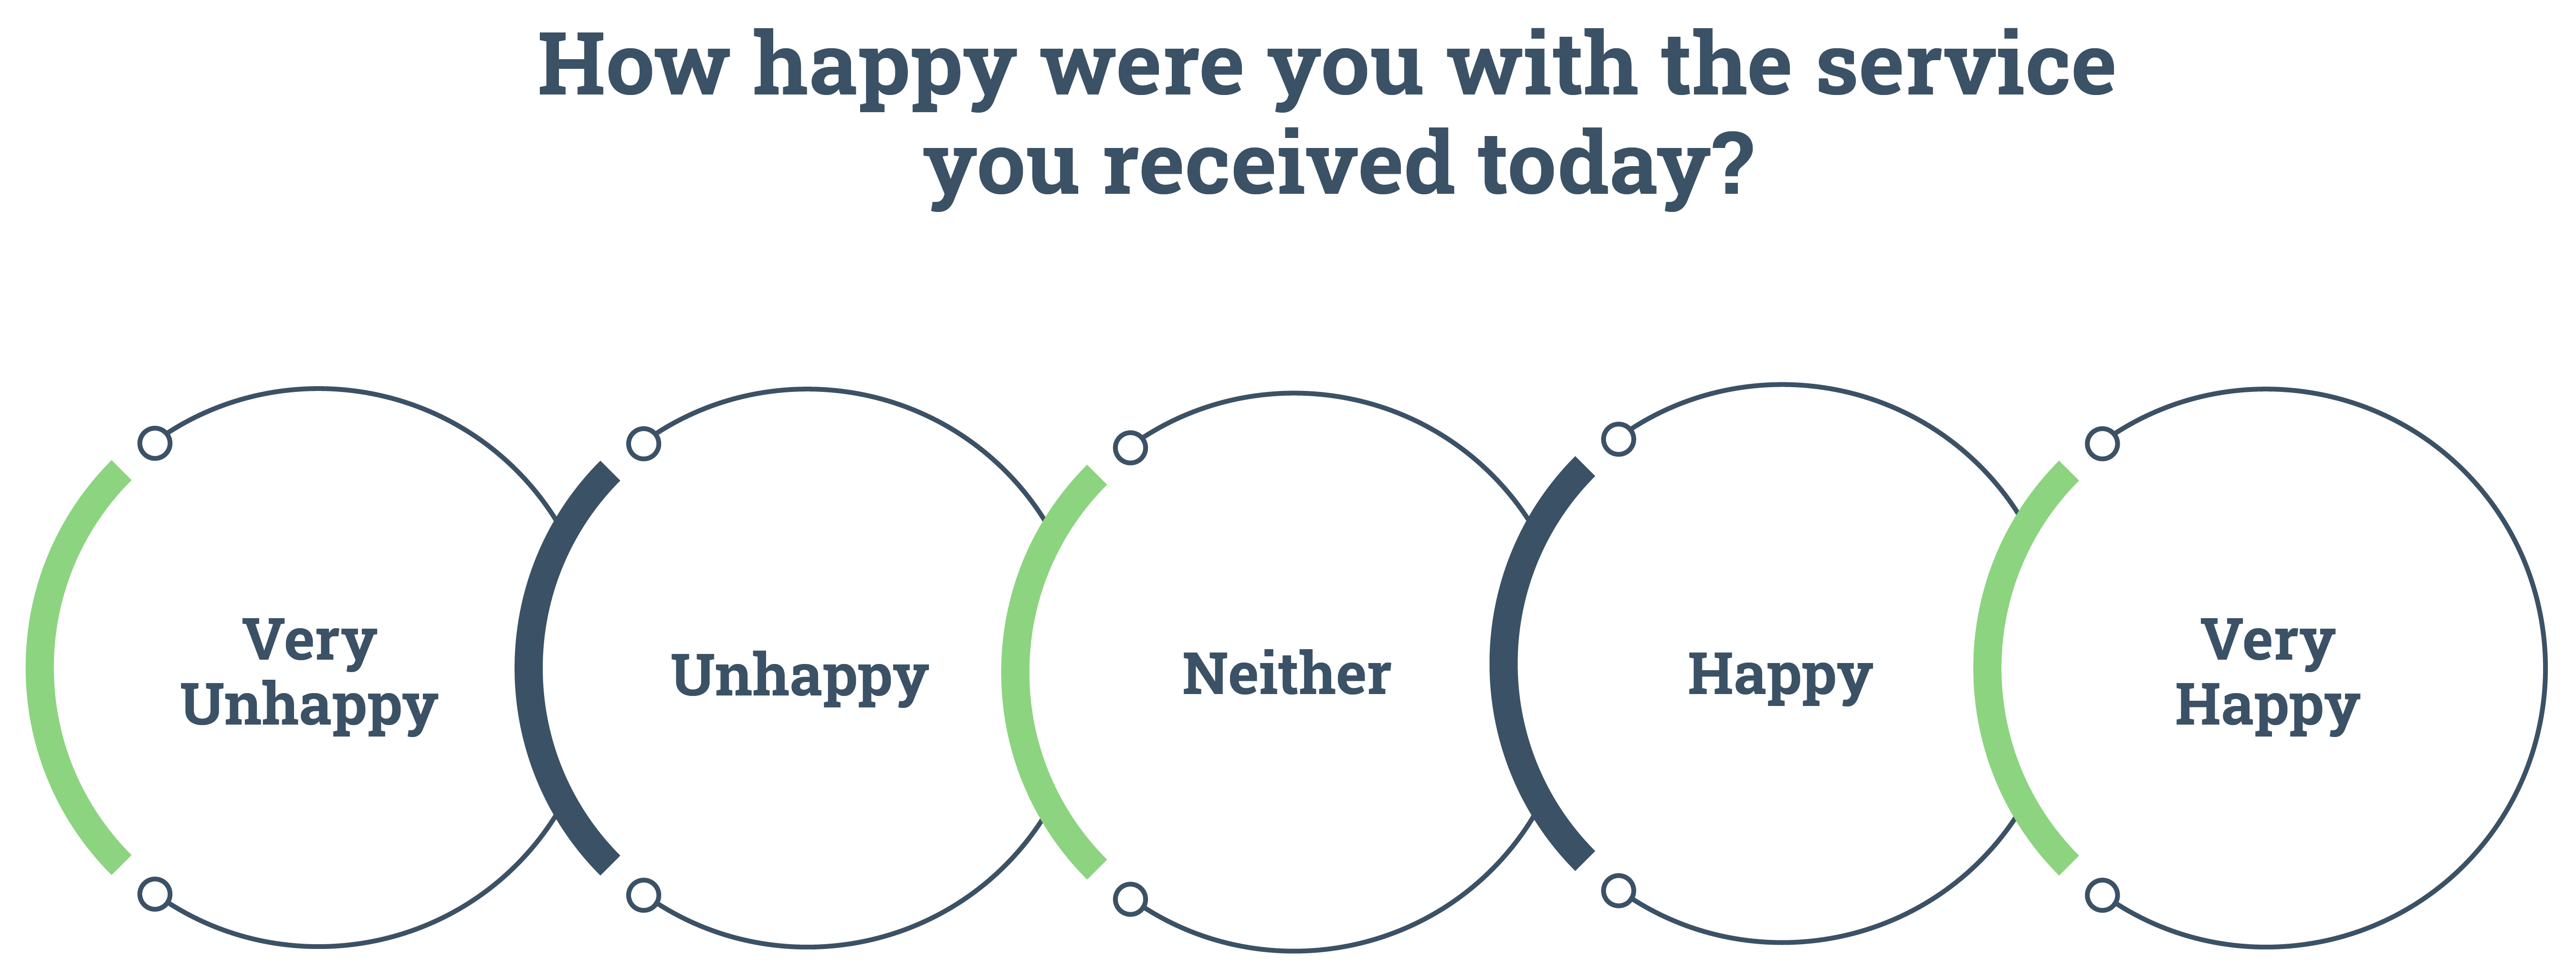
Unlike quantitative, qualitative indicators are not measured by numbers. Typically, a qualitative KPI is given through opinions or feedback. For example, a KPI in a customer service department could be based on customer experiences, with a measurement of how happy a customer was with the service they received.

3. Leading indicators
In short, leading indicators consider what might happen in the future. They are forward-thinking and often used to anticipate the results that occur from a specific business decision. An example of this could be predicting the number of new customers acquired after launching a new product. Once you have established your leading indicator, you can track this against real-time data to check progress and how close it is to your initial prediction. One point to consider here is that just because the leading KPI is positive does not mean the outcome will be the same. If your sales pipeline is being used as a leading indicator of sales, but the opportunities do not convert to sales, the leading indicator will turn out to be inaccurate.
4. Lagging indicators
Where leading indicators look to the future, lagging indicators focus on the actual outcome of a business decision. They are often used to gauge the historical performance of a specific campaign or initiative and can include values such as annual sales, annual net income, gross margin and EBITDA (earning before interest, taxes, depreciation and amortisation). Lagging indicators are useful in terms of assessing the results from a specific action, however, as they provide historical data, it is often too late to make any adjustments for improvement.
5. Input indicators
These are a type of KPI that measure the resources that are required to complete a project or process. These indicators help organisations keep track of how efficiently and effectively they are using their resources and are useful in projects of all sizes. Some examples of these include the number of team members needed, cash on hand, staff time, equipment required or project budget.
6. Process indicators
These are used to gauge the performance and productivity of a process and highlight areas where adjustments are needed. An example of this would be in a customer support team. In this instance, the amount of tickets resolved, opened and average resolution time are all process indicators that show the performance of the customer support process. Based on these values, changes could be made to the process to improve efficiency.
7. Output indicators
These are one of the most frequently used types of KPI and are used to measure the overall performance of a project or activity to determine whether it has been a success or a failure. They can be qualitative or quantitative and used to measure results such as profits, revenue or customer acquisition rates.
8. Practical indicators
These are measurements or data points used to evaluate a specific part of a process or system. They are usually unique to each company as they examine the existing company processes and the effects these have on the business or the strategy.
9. Directional indicators
These look at specific trends within a company to detect any patterns and will involve asking questions such as ‘Where are the metrics moving? Are they improving, declining or staying the same?’ They can be used to assess a company’s success in relation to its competitors and determine where improvements can be made.
10. Actionable indicators
These reflect a company’s commitment to enacting change, measuring how effective the changes have been and if they were implemented within the given timelines. The changes could be within processes, company culture or political action.
11. Financial indicators
Last, but by no means least, is the financial indicators. These are quantitative measures of an organisation’s stability, growth and business viability. While these provide a relatively straightforward insight into the financial health of a company, they are best paired alongside other KPIs to provide a more complete picture of your company’s financial viability. Financial KPIs often include gross profit margin, net profit margin, customer acquisition costs etc.
How to choose your KPIs
With so much data available, it can be tempting to either measure everything, or perhaps go for the things that are simplest to measure. A KPI will only be effective if it is aligned to company goals and objectives, and like any other target, should be well-defined, clear and measurable.

Source: Peter Drucker
Applying the SMART technique to your KPIs is a great way to ensure that any you set are relevant to your overall goals and have the best chance of being effective.
- Specific - Ensure the KPI is specific and clear enough to measure. The information gathered should be relevant and provide information that you can act on. The more general this is, the more difficult it will be to determine if you are succeeding or failing in that area.
- Measurable - Often the most effective KPIs are numeric or can be measured in a quantifiable way. This will show performance or progress clearly and will help to benchmark against past or anticipated performance.
- Achievable - There is nothing more demotivating than striving for a goal that is completely out of reach. You want to make sure you set a KPI that is challenging and ambitious, but that is not unattainable.
- Relevant - If a KPI is not relevant to your overall strategy and goals, then there is no point in acting on it.
- Time-bound - You need to determine the timeframe in which the KPI should be achieved within. If there is no end date in sight, there is much less incentive to achieve the KPI. Determine a regular reporting frequency so that you can track the progress of your efforts.
Conclusion
Many departments go through the process of developing their KPIs, only to realise at the end of the quarter that they are nowhere near them, or worse yet, forgot they had KPIs altogether. Aim to keep your KPIs front of mind and visible to stay on track. Set up regular points where you can review your progress, giving you the opportunity to reflect on what has gone well so far, or what can be improved on. If you only review your KPIs at the beginning or end of a project, then you have lost any chance for improvements.
Track and visualise your KPIs in real-time with Hurree. Get started with your free trial and discover how to truly harness the power of analytics and transform your company reporting using cross-platform dashboards. If you have any questions then feel free to reach out to contact@hurree.co, we'd be happy to answer them!
Share this
You May Also Like
These Related Stories

KPIs for Customer Success Teams

6 Benefits of KPI Reporting

