If you’ve been in just about any executive meeting or performance review, it’s highly likely you would hear the term KPI. A prominent term in business and one that is thrown around a lot, KPI stands for key performance indicator.
Throughout this blog, we’re going to dive into the key benefits and importance of reporting on KPIs regularly. To understand that, it’s important to first know the definition of a KPI and why KPIs are important.
Why are KPIs important?
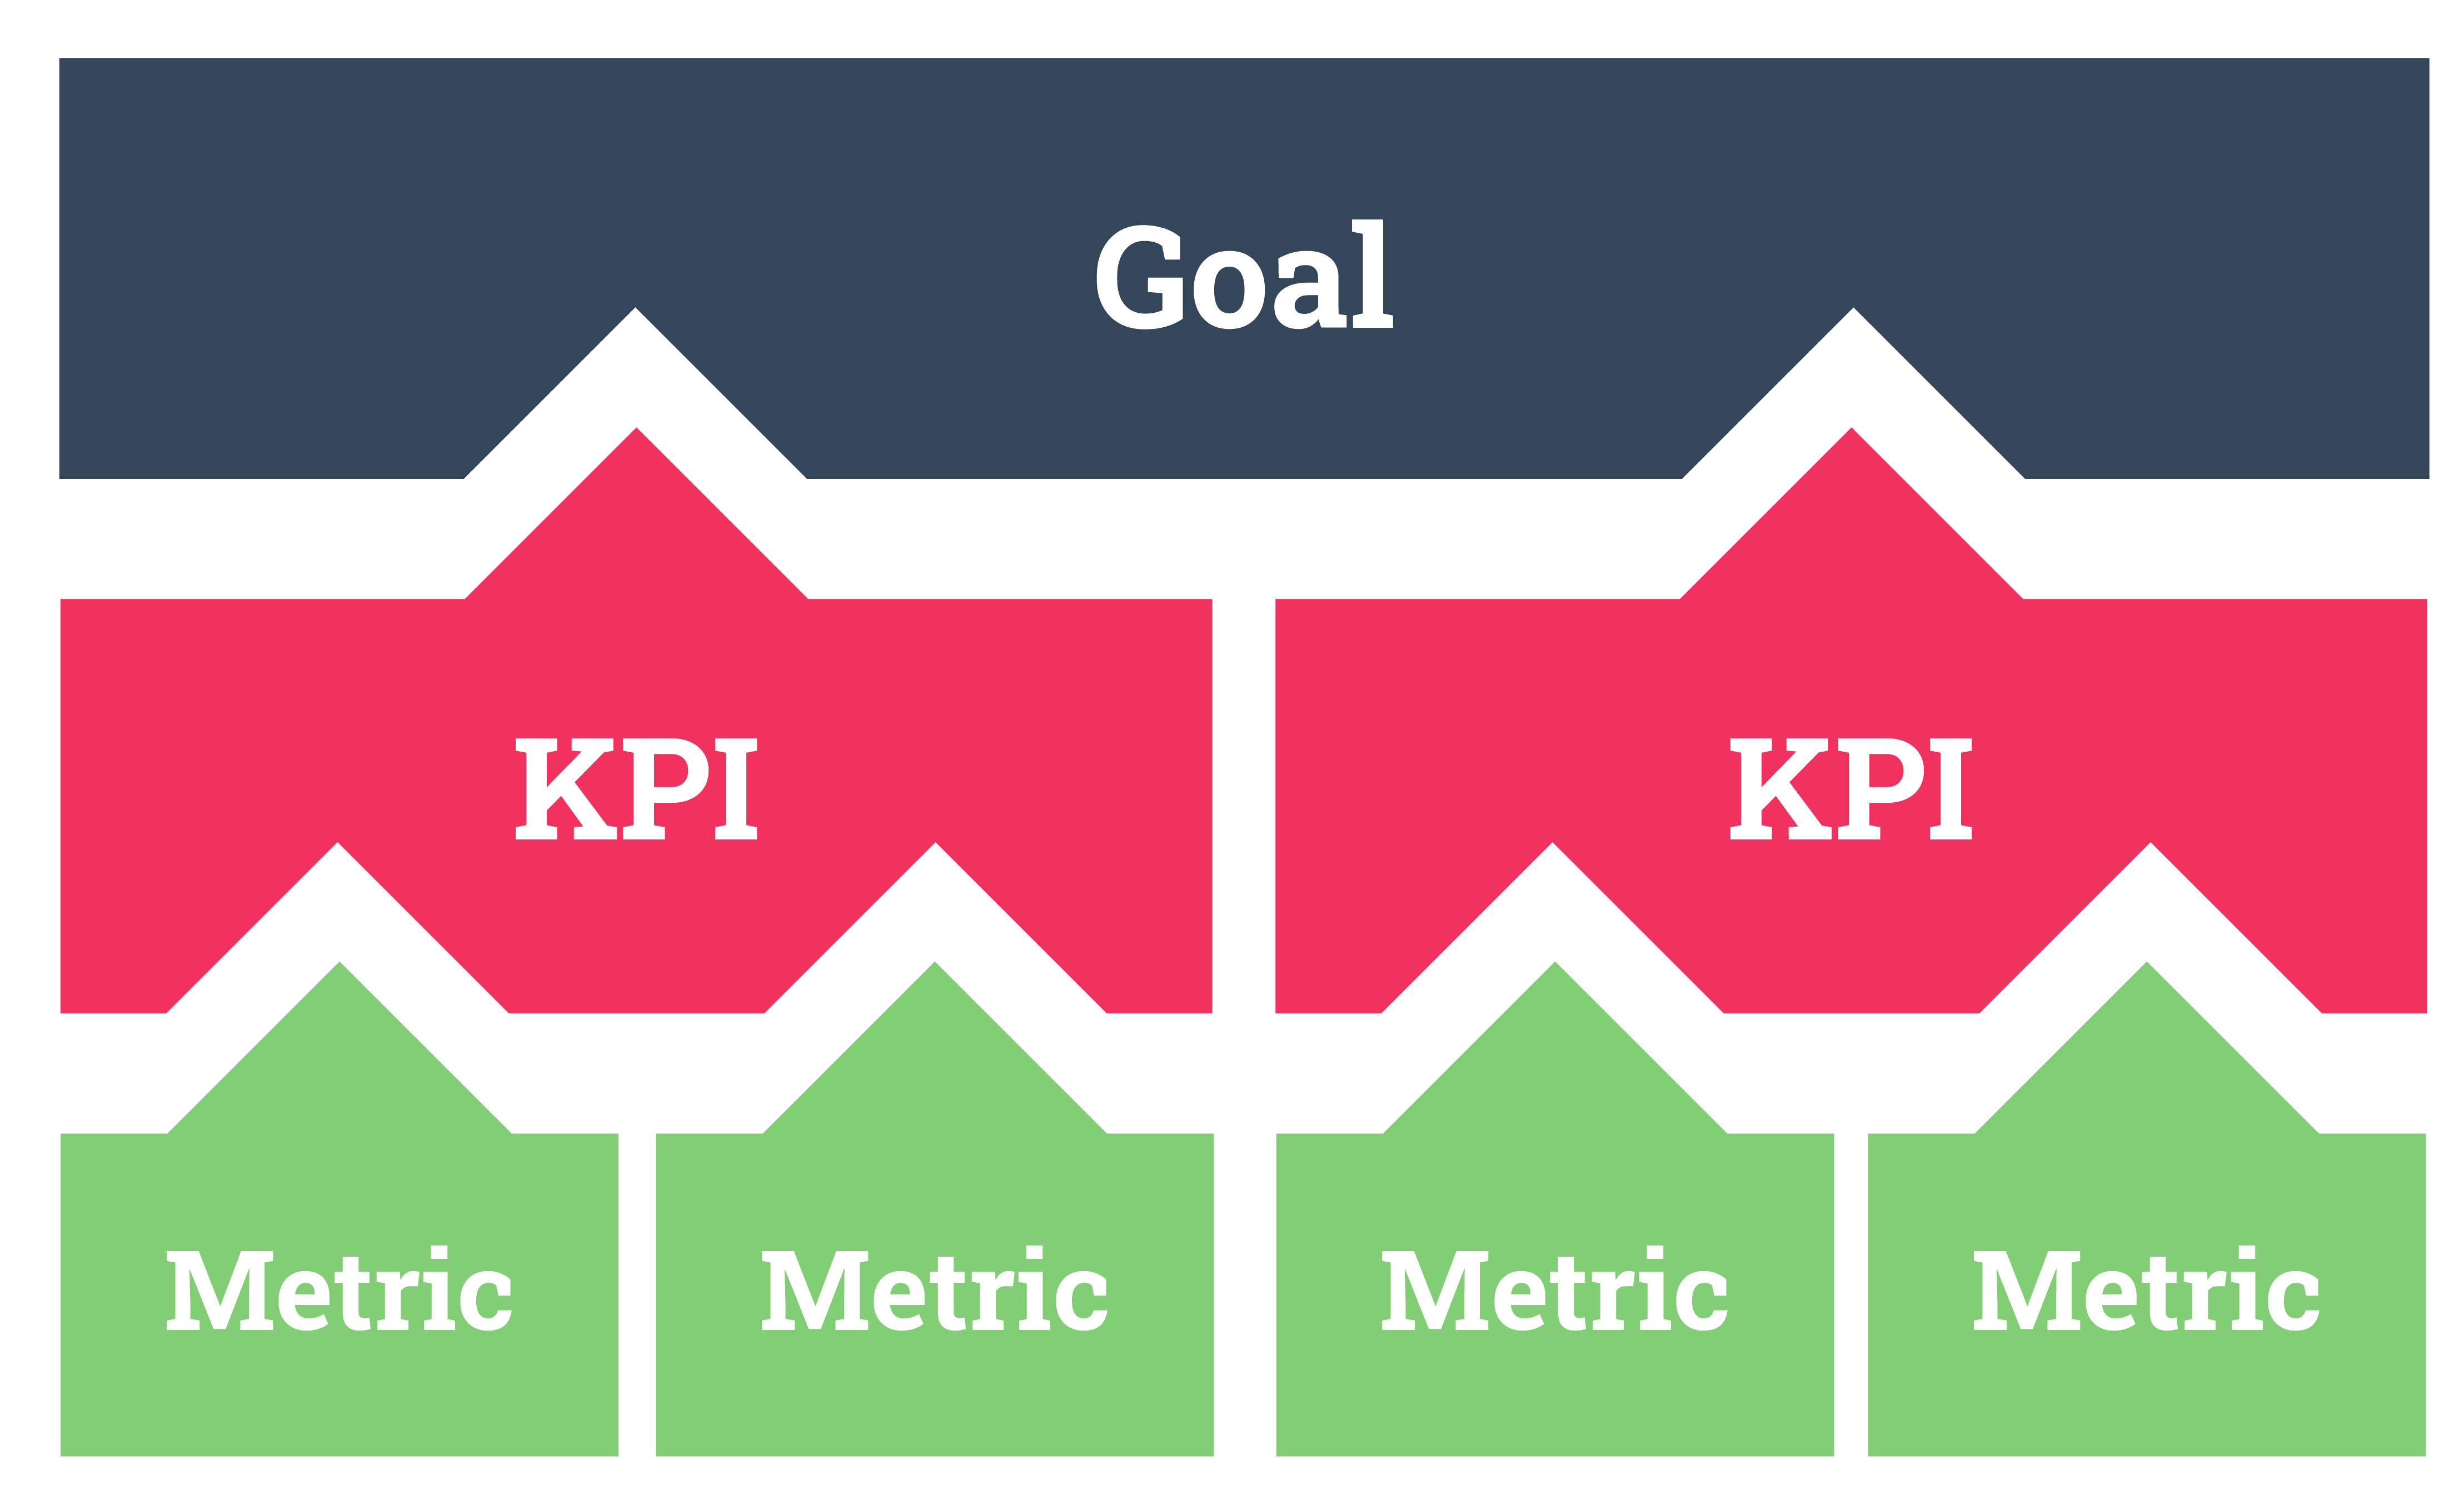
In the realm of business, the importance of KPIs (key performance indicators) cannot be overlooked. On a high level, KPIs tell you whether your business is moving forward or backwards. If you think of goals as where you want to get to, the KPIs are the sat nav that will help get you there. By offering a quantifiable means of measuring progress and performance, they empower you to make informed decisions, allocate resources efficiently, and foster a culture of continuous improvement. They provide a benchmark for you to compare current performance against desired performance, allowing you to make any necessary changes required to get to the desired level of performance. You can also use them to measure your present performance in relation to your desired goals, enabling you to identify and implement any necessary adjustments required to achieve the desired level of success. In essence, KPIs are the cornerstone of data-driven decision-making, accountability, and achieving sustainable success in today's competitive landscape.
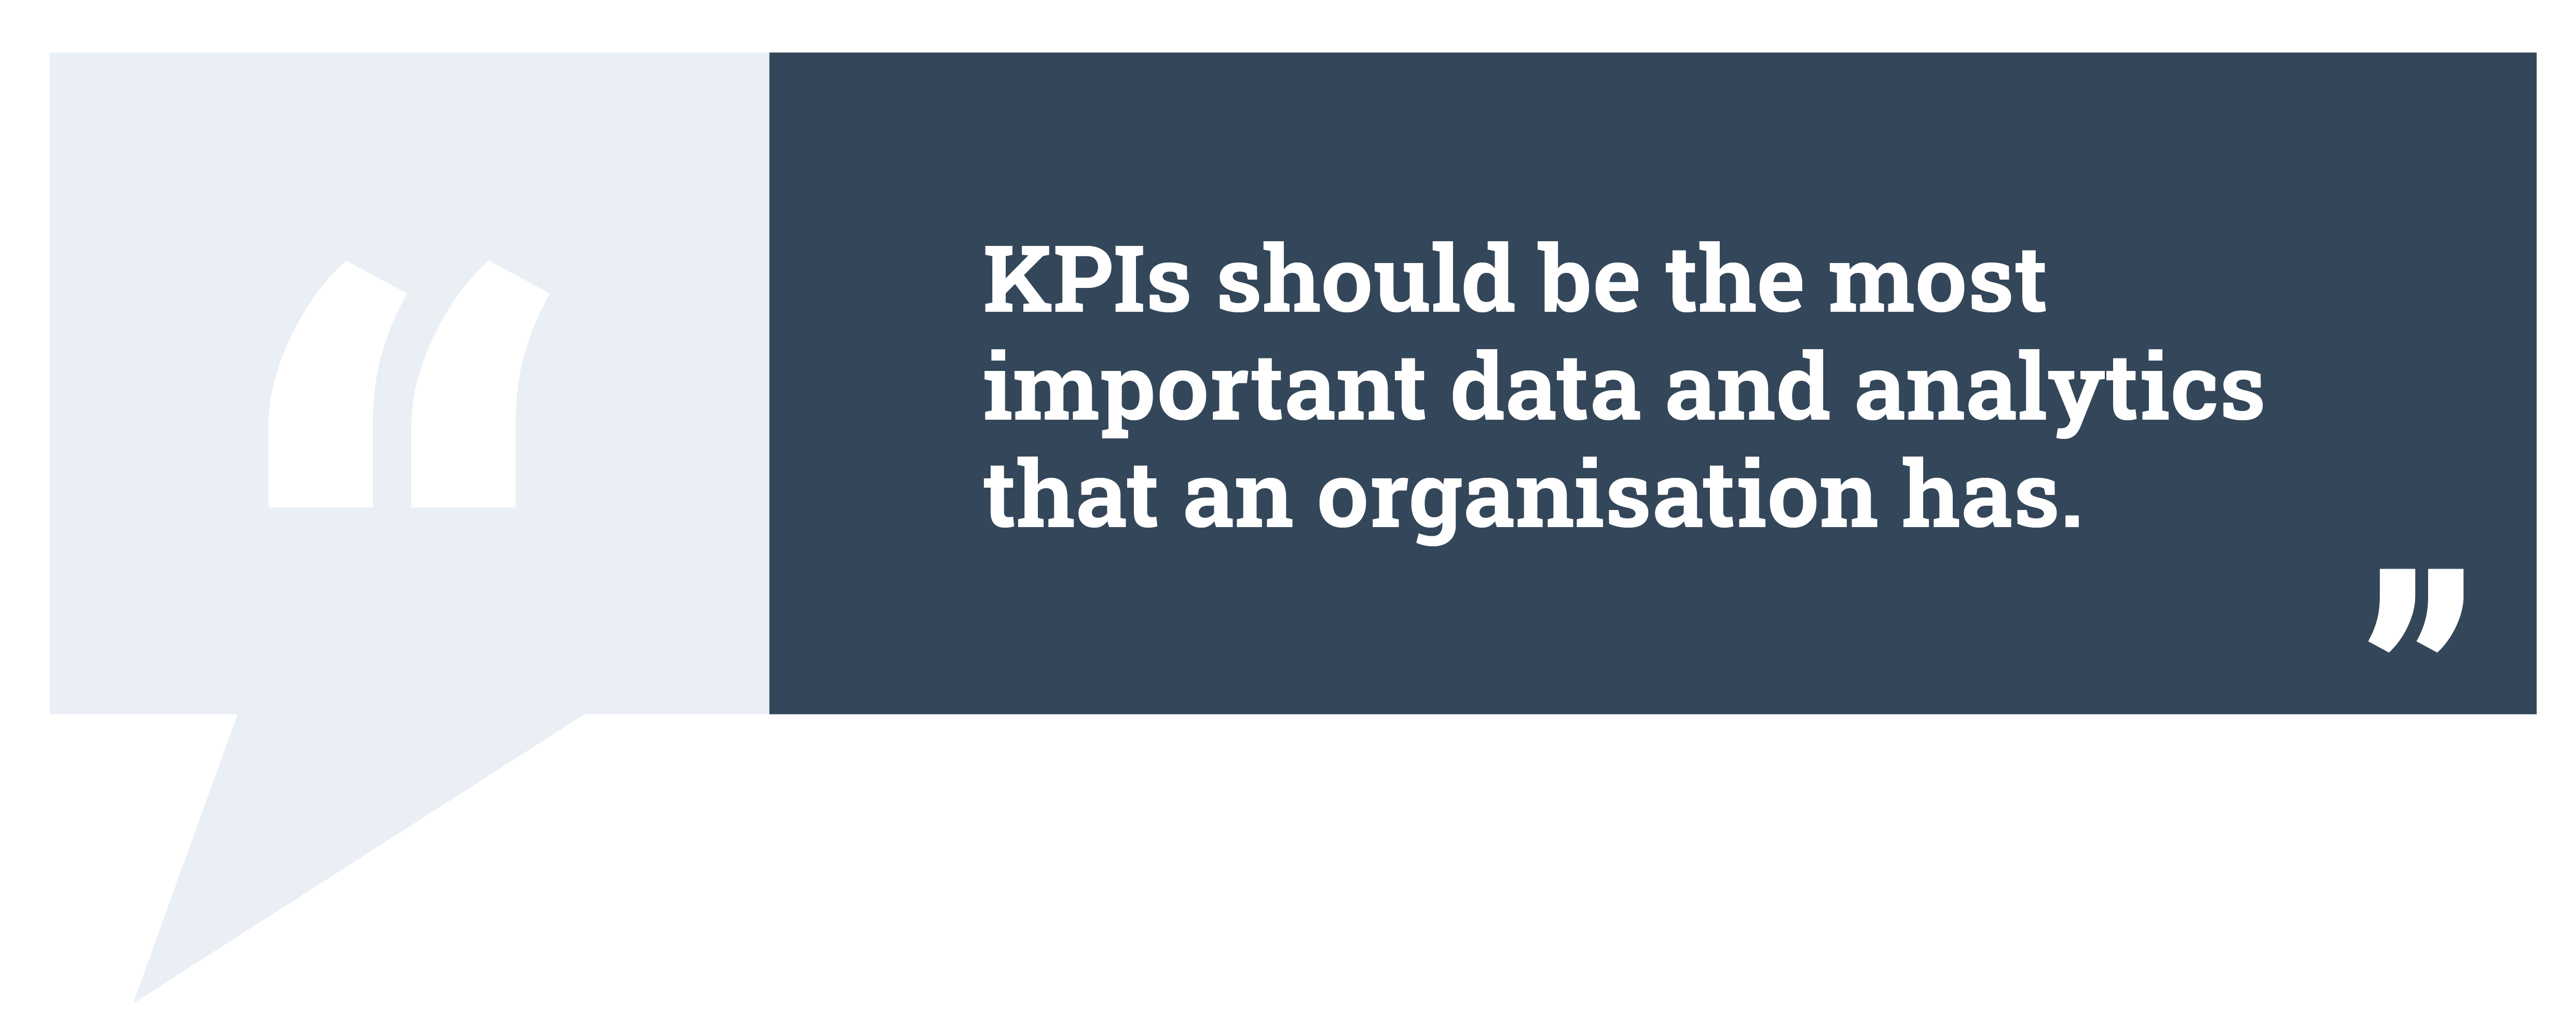
“Key Performance Indicators are the critical (key) indicators of progress toward an intended result. KPIs provide a focus for strategic and operational improvement, create an analytical basis for decision making and help focus attention on what matters most.”
They can come in many different forms, but most commonly are numerical values that are actionable, crucial and should be communicated throughout the organisation.
Leading vs lagging KPIs
Source: MIT Sloan
What is a KPI report?
A KPI report is a comprehensive document that presents key performance indicators in a clear and structured manner. It is typically presented using a mixture of charts, graphs, tabular information to make the data more manageable alongside written copy to provide context and understanding. It’s important not to confuse a KPI report with a KPI dashboard. Unlike dashboards, which offer up to date, immediate data visualisation, KPI reports offer a more in-depth analysis, interpretation, and often include recommendations and plans for future actions based on the data presented. While they are similar, the key to differentiating them is understanding how each one is applied in a business scenario.
With huge amounts of data available, it’s easy to become overwhelmed and miss what is important. We’re willing to guess you don’t have the time or resources to track everything, so it’s crucial to sift through and select the information that is relevant and will be the most beneficial to report on regularly. Every organisation will use valuable resources on campaigns and business activities, so it makes sense to measure progress to ensure those resources aren’t being wasted. So if you want to meet your organisation’s objectives, then a KPI report is a great place to start.

KPI report vs KPI dashboard
A KPI dashboard is a visually engaging display of progress that provides real time or near-real time data on performance. By displaying the data in tables, charts, graphs and other data visualisation elements, it is easily digestible and understood. They are designed to offer a quick and immediate overview of performance, making it easier to monitor progress, spot trends and make data-informed decisions. KPI dashboards show the current state of affairs, allowing for quick assessments and course corrections when necessary.
A KPI dashboard is a user-friendly, visual representation of your key performance indicators that provides real-time or near-real-time data about an organisation's performance. It typically consists of graphs, charts, gauges, and other visual elements that display key metrics in a concise and easily digestible format. KPI dashboards are designed to offer a quick overview of critical performance indicators, making it easier for users to monitor progress, identify trends, and make informed decisions on the fly. Unlike KPI reports, which provide in-depth analysis and historical data,
A KPI report, on the other hand, is a static, structured document that provides a detailed analysis of an organisation's performance based on specific KPIs. It focuses on the analytical interpretation of underlying metrics, mostly via tables, charts and graphs to help make decision making easier and helps with long-term planning within an organisation. KPI reports collate historical data over a specified time period, for example, if you want to understand how well your social media strategy worked in Q1. In this instance, looking at a real-time dashboard may not be enough to fully gauge the success and draw conclusions, instead you will need data over time.
The KPI report is prepared to assist in the next steps and unlike a dashboard that only provides metrics in a visually engaging way, the KPI report will provide some of the same information but will have more analysis, interpretation and explanations to help stakeholders understand the data and its implications. A KPI report will often contain recommendations and plans for the next steps often include recommendations and action plans to improve performance in areas where KPIs may not have met targets.
As highlighted above, dashboards and reports are different, however, they still serve the same purpose, to help make data-driven decisions and show progress and performance.
6 Benefits of reporting KPIs
1) Improve employee engagement and morale
Setting KPIs for individuals can drastically boost morale, create accountability and improve overall performance. It can be encouraging for employees to have a goal to work towards and know that they have met their goals at the end of each month or year. In some organisations, KPIs are often linked to incentives, such as monthly bonuses being given to those who secure the most sales or bring in the most revenue. Other examples could be team lunches, days off or non-monetary incentives like gift cards or vouchers. Having these incentives can empower and encourage employees to hit their goals and is a great way to develop a culture that celebrates and encourages success.
Setting departmental KPIs can help to encourage communication and collaboration between team members. When setting these it’s crucial that they are achievable and truly under their control. If employees are held to a standard that they believe they can not achieve, morale and engagement may rapidly decline. In a study of call-centre employees, engaged and satisfied employees are 8.5 times more likely to stay than leave within a year, 16 times more likely to refer friends to the company and are 3.3 times more likely to feel extremely empowered to resolve customer issues.
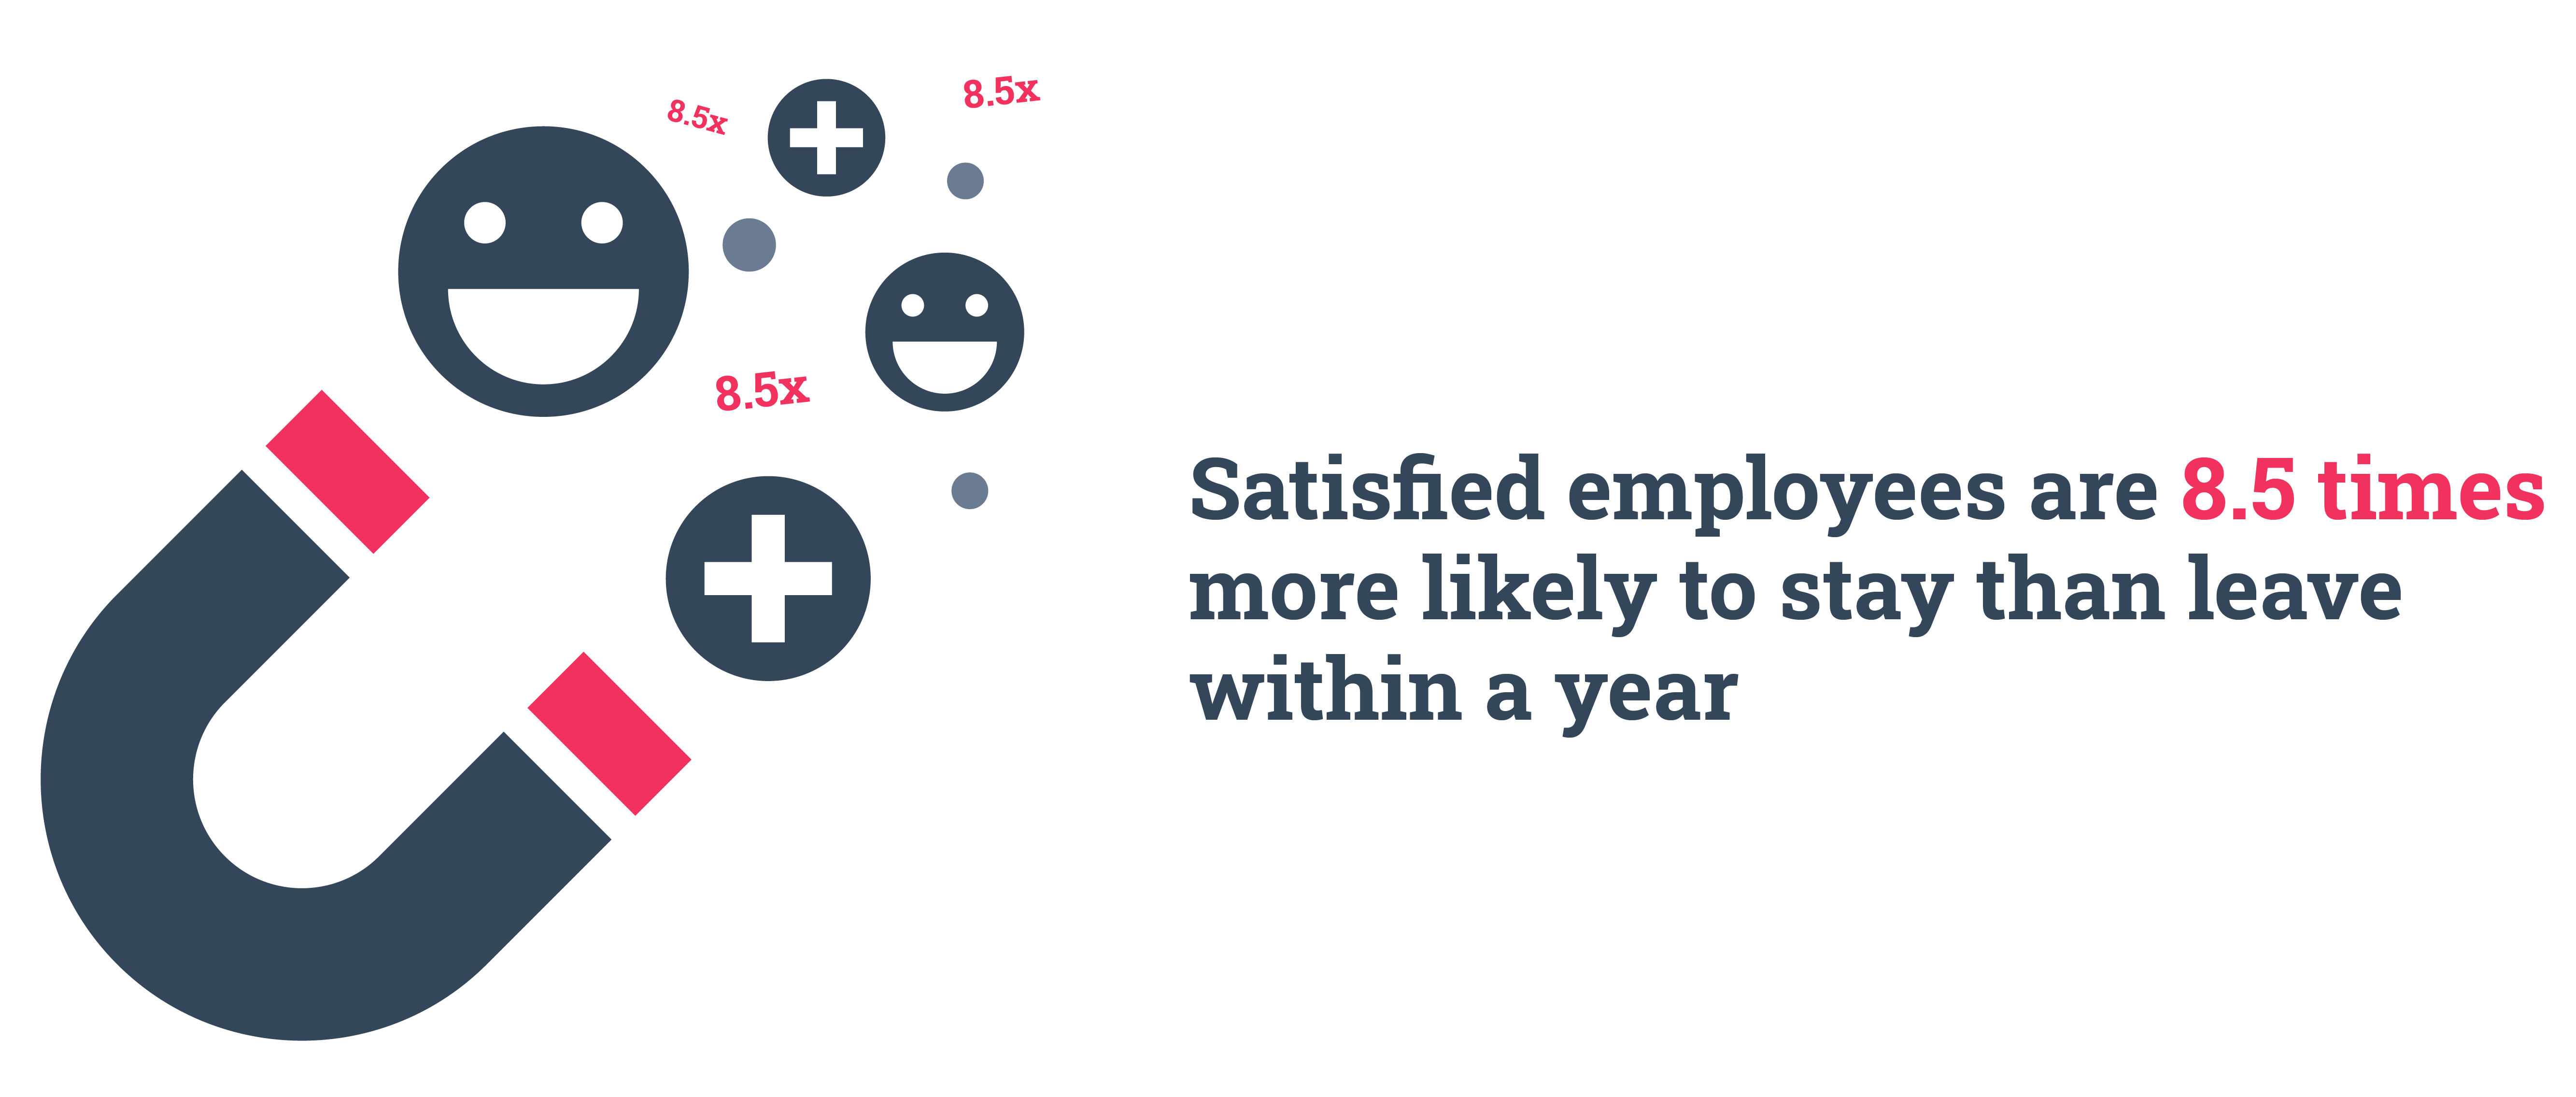
Source: McKinsey & Company
2) Close learning gaps
It is difficult to argue with data, so if one individual or department isn’t performing efficiently then KPIs will highlight this and can help figure out why. When employees consistently fall short of KPI targets, it may indicate gaps in their skills or knowledge. Reporting highlights these deficiencies, making them evident to both employees and management. The process of addressing an underperforming employee becomes much more manageable when both management and employees know their expectations and have the KPI report to prove whether it’s being met or not.
KPIs also provide an objective basis for evaluating employees' performance. Rather than relying solely on subjective assessments where some form of bias may creep in, managers can use concrete data from KPI reports to measure progress and determine the effectiveness of training initiatives in closing learning gaps. Armed with insights from KPI reports, organisations can design targeted training and development programs to address specific areas where performance is lacking. These programs can include workshops, courses, mentorship, or access to learning resources, all aimed at closing the identified gaps.
3) Measure performance
Not surprisingly, one of the main reasons why reporting on KPIs is so important is to measure performance. They enable organisations to evaluate the performance of various aspects of their operations, from employees to marketing campaigns and provide a quantifiable way to measure progress towards a specific goal or objective. They offer a clear understanding of whether a business is moving in the right direction or if adjustments are needed. A good KPI should be measurable and trackable, so whether it’s a specific marketing campaign, new business initiative or sales strategy, reporting on KPIs will allow you to measure how close you are to achieving the overall target. Being able to see areas where things aren’t going to plan helps team leads make a decision on the strategies they need to improve on.
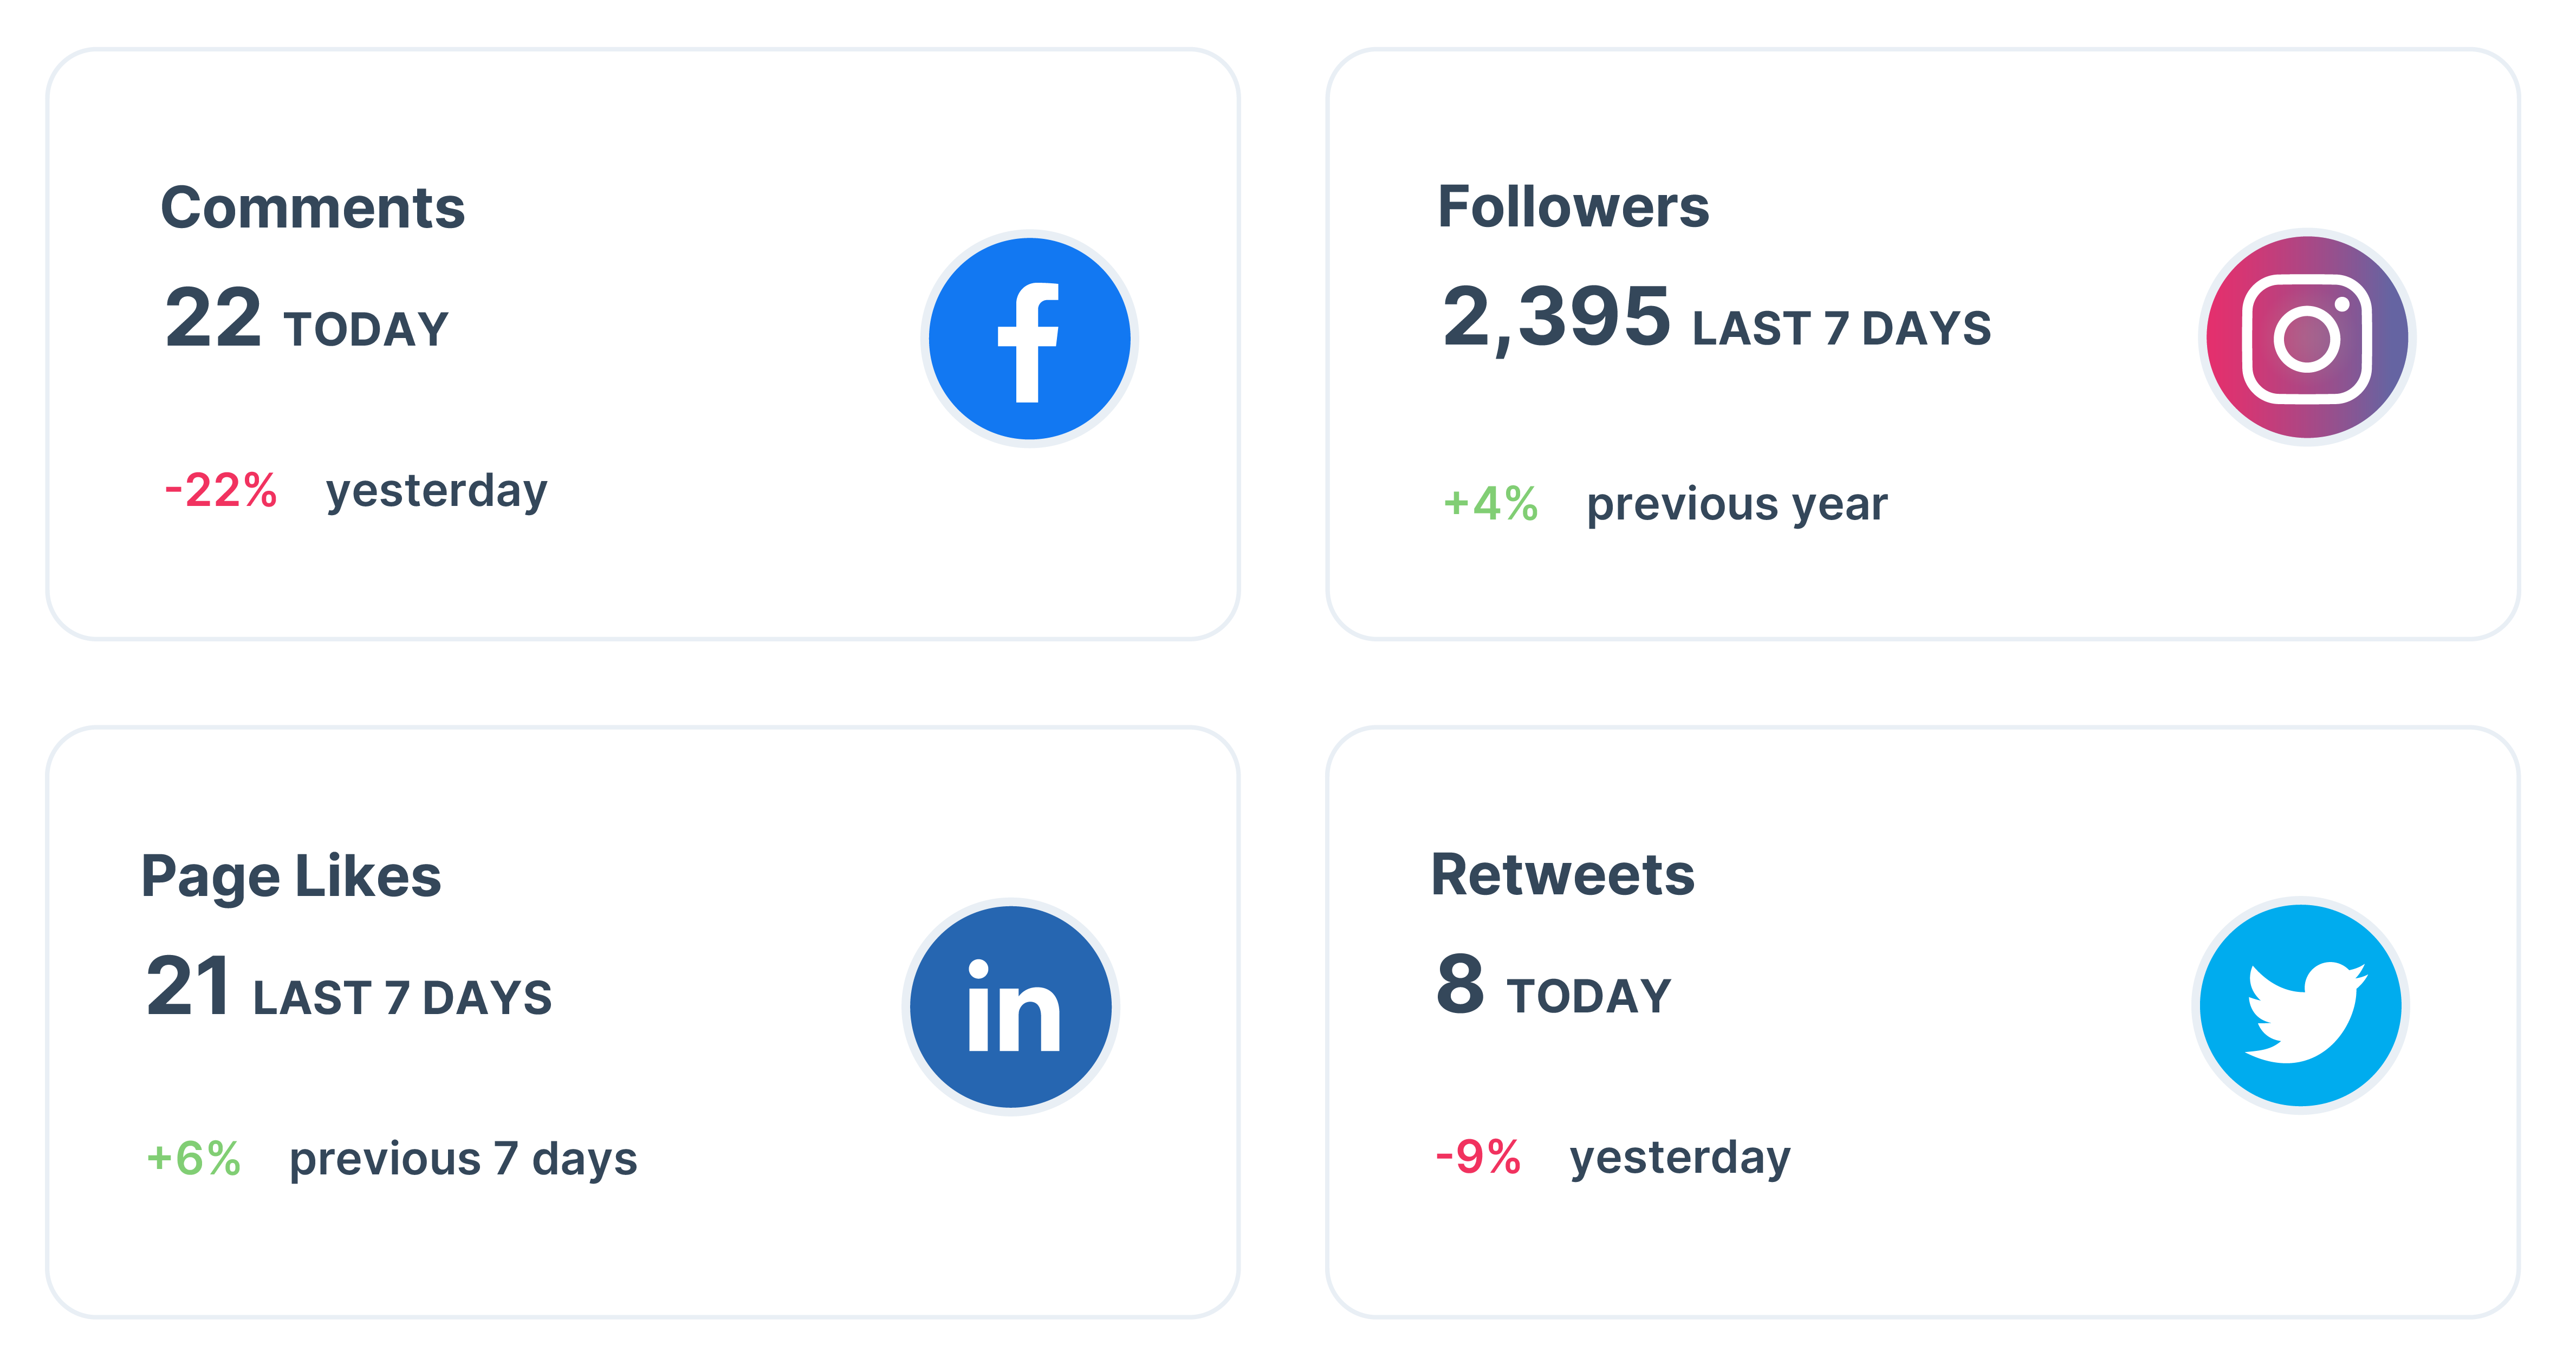
Say for example, at the start of the year your marketing target is to reach 1,000 Instagram followers by the end of Q1. Based on this, you might aim to get around 333 followers in January, February and March, however your January report shows that you only gained 100 followers. At this stage, you would need to implement a new strategy in order to reach the goal by the end of Q1.
4) Help to make decisions
KPIs provide data-driven insights into various aspects of your performance or project. This data serves as a basis for making decisions that are rooted in evidence rather than just intuition or gut feeling. KPIs are useful to help inform decisions, however, they should not make the decision for you. It can be tempting to look at one KPI alone and use this to determine whether a campaign is going well. On the other hand, it can be tempting to scrap certain KPIs because they aren’t telling the full story.
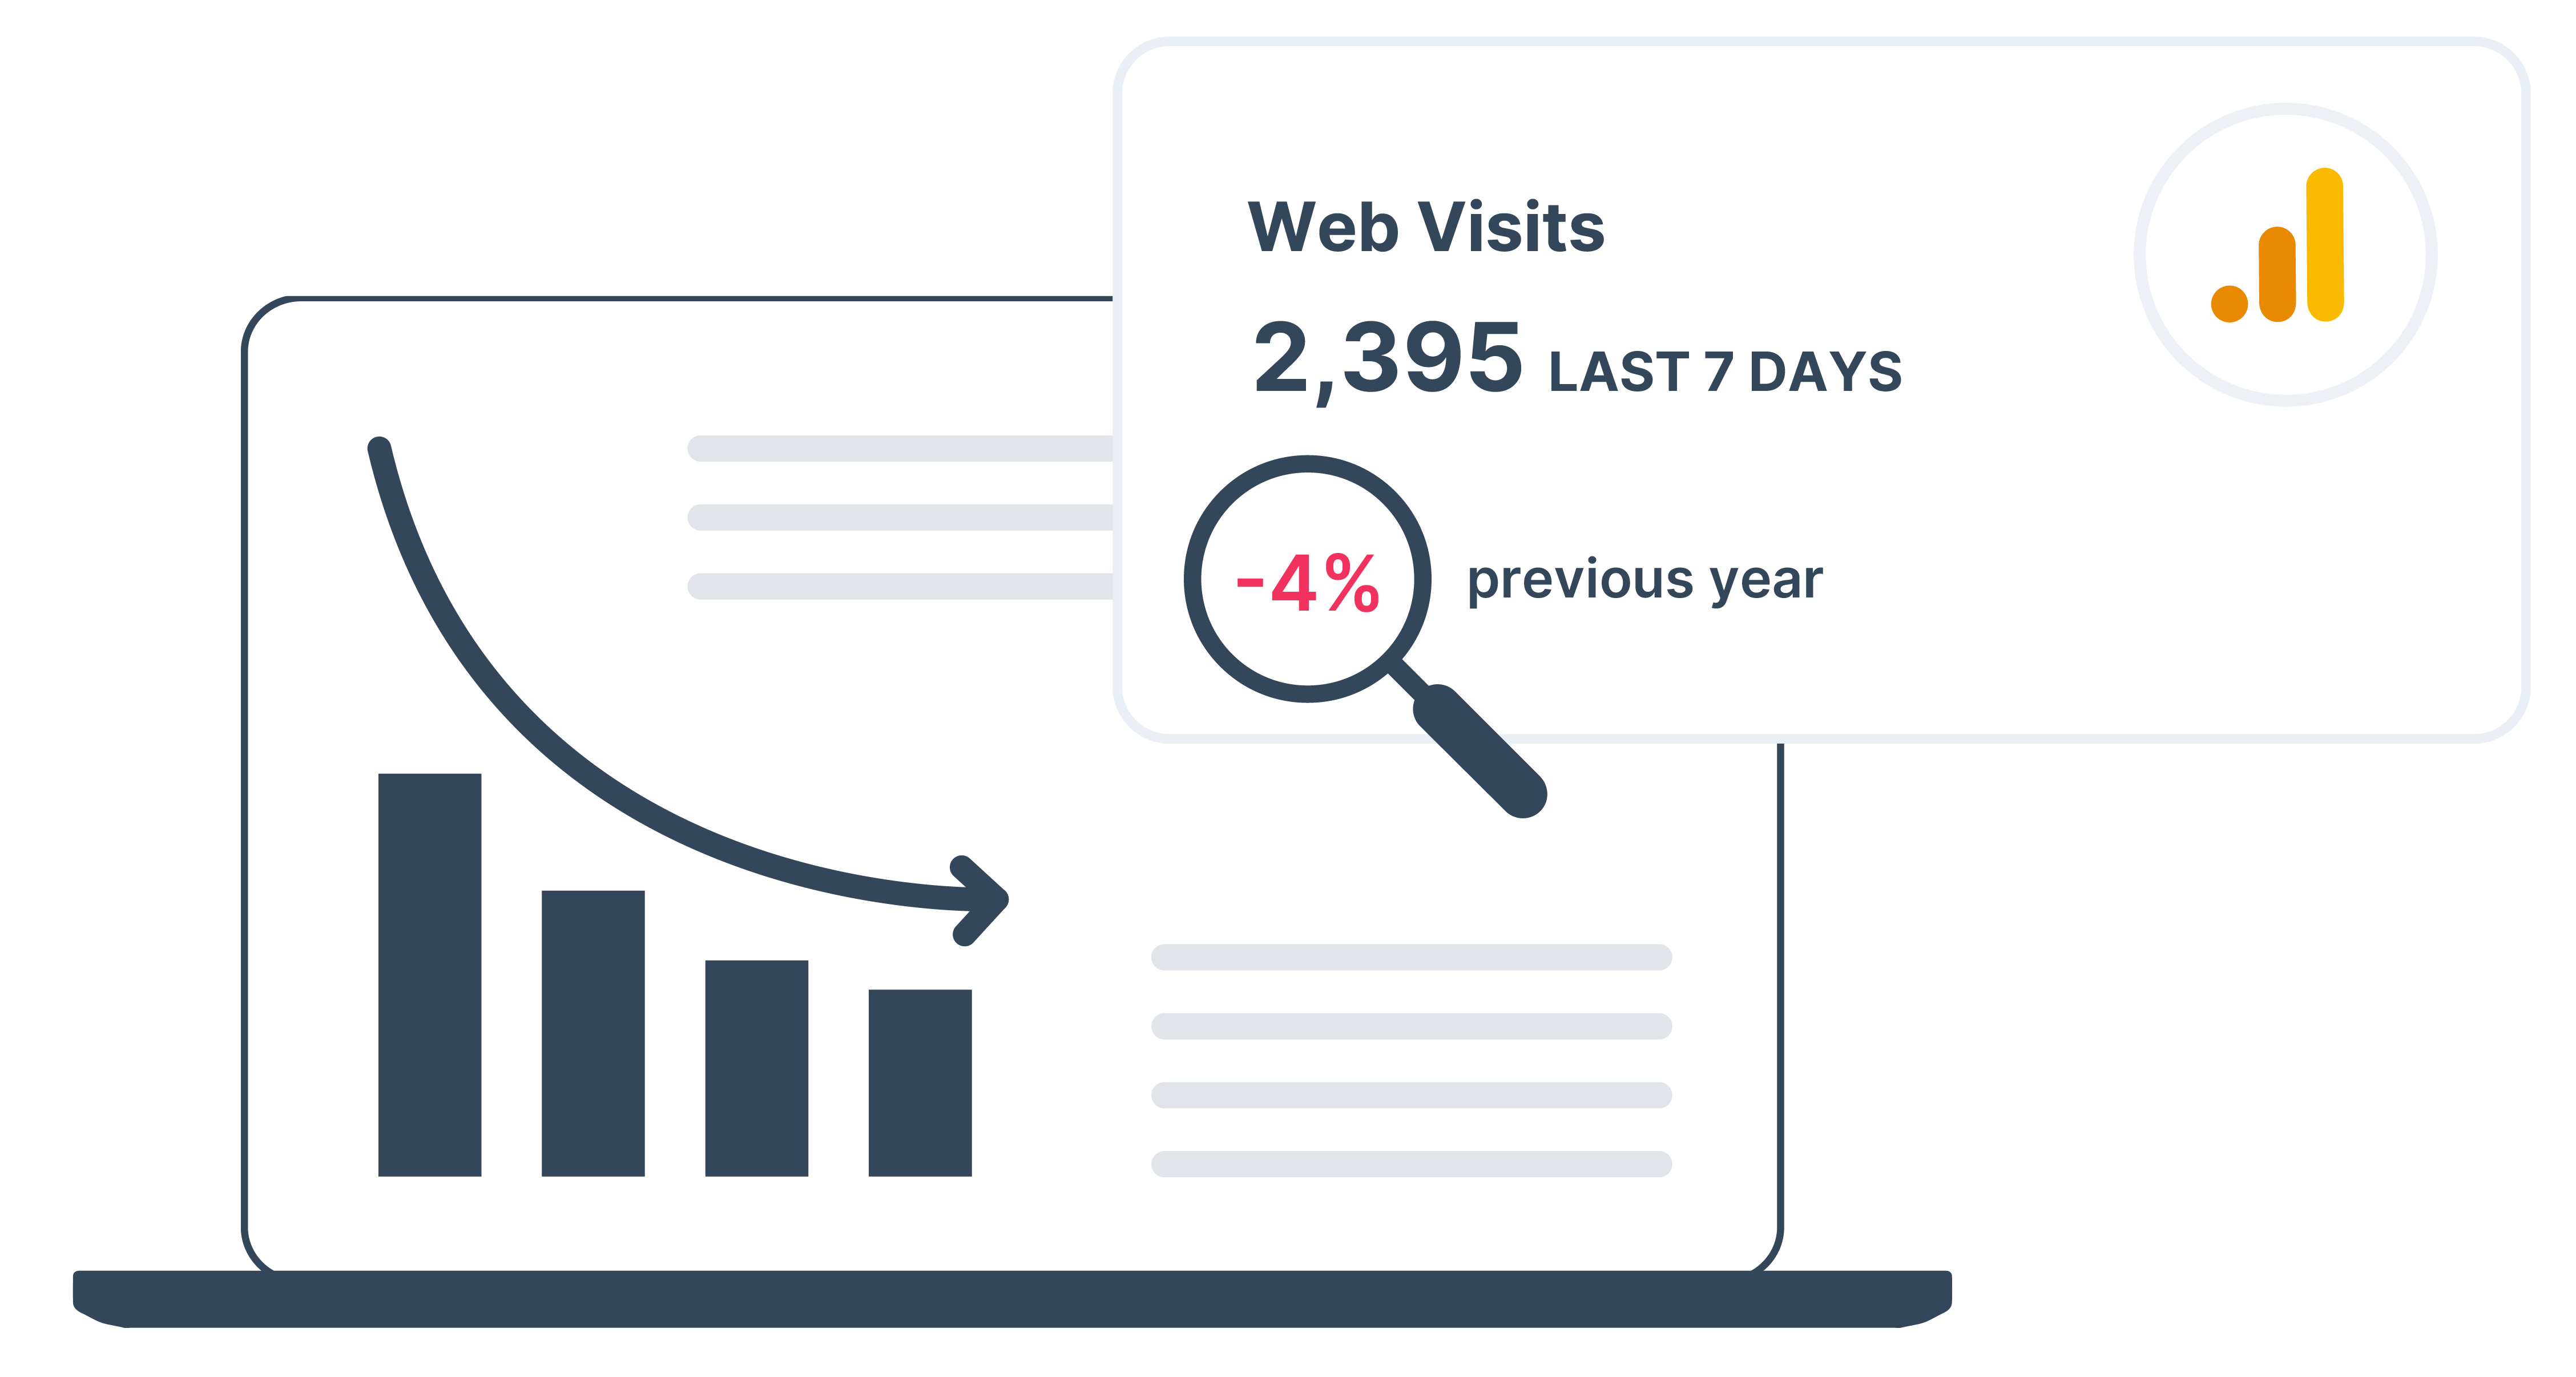
To fully appreciate KPIs and use them to make informed decisions, it is best to take others into consideration. Say, for example, you notice the number of visitors to your website has dropped substantially. Instead of jumping to the conclusion that you aren’t creating the right content or implementing SEO techniques, it’s important to look at the bigger picture such as time on site, Google ranking and page views per visit. After examining these, you might notice that the issue stems from your Google rank, which has dropped significantly due to spammy backlinks. A single KPI can be the trigger that a decision needs to be made, but to make the most informed decision, it is best to consider other metrics.
5) Detect patterns over time
KPIs often allow for comparisons between different time periods allowing you to compare current performance with past performance to identify improvements, declines, or cyclic patterns. When recording and measuring weekly, monthly or quarterly KPIs, you have a greater opportunity to spot patterns and trends. This is because visual representations make it much easier to spot compared to looking at raw data in spreadsheets, so presenting your KPIs in the form of bar charts, pie charts, line graphs, is extremely beneficial - this is easily done using a dashboard. This will allow you to make adjustments if necessary in order to achieve the KPI in the given time frame. For instance, if you know historically that you get less engagement on your social media channels during the summer months, you could plan a social media campaign to run over June, July and August to ensure engagement doesn’t drop, or you could use this downtime to do research or training in social media to avoid this happening in future.
6) Help to set goals and plan
To reach your overall business objectives, you need to set a target and aim towards it. KPIs provide a way to quantify goals. Instead of setting vague goals like "increase sales," you can set a specific goal like "increase sales by 10% in the next quarter." This makes it easier to track progress and success. It can sometimes be challenging to keep all team members or departments within the business aligned and working toward a shared goal. Once the overall objective has been set, KPIs will help to break it down into more manageable and achievable chunks and allow you to plan your strategies on how you will get there. Once KPIs have been set however, it doesn’t mean they cannot change. If your KPI report highlights that the KPIs are never being met, then it might be necessary to review and adjust these.
Sales team KPI examples
• Lead-to-Customer Conversion Rate – Measures how effectively leads become paying customers.
• Average Deal Size – Indicates the value of each sales opportunity.
• Customer Acquisition Cost (CAC) – Ensures the business acquires customers sustainably.
• Quota Attainment Percentage – Monitors individual rep performance against targets.
Implementation challenges in KPI reporting
- Inconsistent data entry, which creates unreliable metrics.
- Unclear KPI definitions, leading to misaligned expectations between teams.
- Lack of system integration, causing double entry, data silos, and reporting delays.
Conclusion
Understanding why KPIs are important and the benefits of reporting on KPI is a great first step to success. Once the KPIs are set, measuring and analysing them is vital. This doesn’t have to be a painful, time-consuming process. Whether you are using a CRM or Excel spreadsheet, integrating your KPIs from your various tools onto a cross-platform analytics dashboard can make a massive difference. Having up to date metrics, all in the one place, allows teams and individuals to improve progress and time spent on activities. Being able to have a high-level overview of which metrics need improvements and which ones are performing well can free up valuable time, allowing you to work more efficiently.
Track and visualise your KPIs in real-time with Hurree. Get started on your free trial today and discover how to truly harness the power of analytics and transform your company reporting using cross-platform dashboards. If you have any questions then feel free to reach out to contact@hurree.co, we'd be happy to answer them!


Share this
The 11 Social Media KPIs You Should Really Be Tracking

[Infographic] 6 KPIs That Marketers Should Be Tracking