In 2026, after three structural shifts in digital measurement (iOS tracking restrictions, third-party cookie deprecation, and the open-source MMM revolution), MMM is in the middle of a genuine renaissance. It is no longer the specialist tool used only by TV-heavy consumer-goods brands, it is one of the three measurement methods every serious marketing team now runs.
In retail industries, only 8-10% of sales revenue goes toward marketing activity, which means CMOs are under constant pressure to prove where every pound landed and where the next one should go. MMM is how most mature teams answer that question across both digital and traditional channels. This piece covers what MMM is, the benefits and limitations in their 2026 form, the Google 4-step preparation framework, the Nielsen 4-stage execution framework, the modern tooling landscape, and how AI has reshaped the discipline.

What is Marketing Mix Modelling (MMM)?
Marketing strategy still rests on the 7Ps of the marketing mix, product, price, place, promotion, people, process, and physical evidence, the modern evolution of Kotler's original 4Ps framework. MMM asks a simple question of that mix: How much did each element contribute to the business result, and what will happen if we change the mix for the next period?
Mechanically, MMM is a statistical method that uses historical sales and marketing data to attribute revenue to each driver (marketing activity, pricing, distribution, seasonality, macroeconomic factors), then uses the resulting model to forecast and optimise future allocation. The output is a decomposition of sales showing how much each tactic contributed, plus a set of equations that let the team simulate "what if we moved £500k from TV to digital" scenarios before committing budget. It is as close as marketing measurement comes to a laboratory.
Why is MMM having a renaissance in 2026?
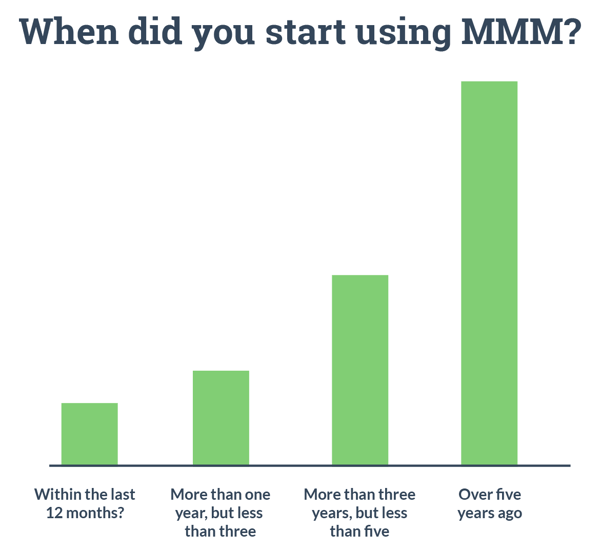
MMM existed quietly as a specialist practice from the 1980s to the late 2010s. Then three structural shifts moved it to the centre of marketing measurement in just four years:
|
Shift |
Year |
What it broke |
Why MMM benefits |
|---|---|---|---|
|
iOS 14.5 and App Tracking Transparency |
2021 |
Mobile app and in-app user-level tracking |
MMM uses aggregated data, not device IDs |
|
Third-party cookie deprecation |
2024–2025 |
Cross-site user-level attribution |
MMM does not depend on cookies |
|
Open-source MMM frameworks |
2021 (Robyn), 2025 (Meridian) |
High cost and slow turnaround of enterprise MMM |
Modern frameworks produce weekly refresh at low cost |
The combined effect is that MMM is now accessible to mid-market brands and refreshable at a cadence close to digital analytics, removing both the limitations that made it feel outdated in 2020.
Benefits of Marketing Mix modelling
- Prove marketing ROI across every channel, including offline: TV, OOH, print, podcast, and retail-media networks that no digital attribution model can see are measured properly.
- Optimise budget allocation across the full mix: The "what-if" simulation lets teams rebalance spend before committing it, not after.
- Privacy-resilient measurement: Aggregated data means MMM is unaffected by iOS, cookie, and GDPR changes that have degraded user-level attribution.
- Context-rich forecasting: MMM incorporates seasonality, pricing, distribution, and macroeconomic factors that attribution models ignore.
- Credible scenario planning for the C-suite: When executives ask "what happens if we cut marketing by 20%?", MMM is the only method that can answer honestly.
Limitations of Marketing Mix Modelling
- Needs substantial historical data: Typically two to three years of weekly spend and sales data, though modern Bayesian frameworks with encoded priors have reduced this somewhat.
- Aggregate, not individual-level: Measures channels and tactics in aggregate, cannot credit a specific customer's purchase path.
- Modelling judgement still matters: Garbage in, garbage out. Output depends heavily on data quality, variable selection, and assumptions.
- Longer feedback loops than digital analytics: Even modern weekly-refresh MMM is slower than real-time dashboards, which is why it should guide strategy and budget allocation rather than daily tactical decisions.
MMM, multi-touch attribution, and incrementality: The three-method stack
The 2020 framing often set MMM against multi-touch attribution (MTA) as rivals. Modern teams run three measurement methods in parallel because each answers a different question:
|
Method |
What it measures |
Best for |
Weakness |
|---|---|---|---|
|
Marketing Mix Modelling (MMM) |
Aggregate contribution of every channel to sales |
Strategic budget allocation, offline and brand spend, privacy-constrained environments |
Slower cadence, aggregate-only |
|
Multi-touch attribution (MTA) |
User-level credit across digital touchpoints |
Tactical digital routing within campaigns |
Weakened by iOS and cookie changes |
|
Incrementality testing |
True causal lift from a specific channel or campaign (via holdout) |
Validating specific channel claims and keeping MMM/MTA honest |
Expensive and time-limited to run |
The strongest 2026 measurement stacks use MMM for strategic allocation, MTA for tactical digital decisions where it still works, and incrementality tests to validate the models. Hurree's own comparison of ROAS and ROI as metrics sits alongside this three-method view, since each ROI definition answers a slightly different measurement question.
How to get started with Marketing Mix Modelling?
Before building an MMM programme in-house or with a vendor, Google recommends four preparation steps that make or break the project:
Step 1: Establish goals
The purpose of MMM is to answer specific business questions, not to produce a report. Outline the key questions you want the model to answer before any data is collected. Common examples:
- Budget: Which marketing tactics have the best median return on investment (MROI)?
- Media: Would increasing the TV advertising budget by 15% increase our incremental sales?
- Pricing: What is the impact of a price change on sales and profits?
- Competitive: Which competitors' advertising campaigns are having the most significant impact on our sales?
The questions guide the size and range of your MMM analysis and help you understand what data is needed. For teams building strategy from the ground up, the five components covered in Hurree's guide to building a marketing strategy typically determine which MMM questions matter most.
Step 2: Align your organisation and key stakeholders
MMM requires data from across the business. You will need to engage the gatekeepers of each dataset, establish responsibilities, and create a processing timeline. Likely stakeholders:
- CMO (Chief Marketing Officer)
- TV and media agency partners
- Marketing agency partners
- CRM manager
- Marketing executives
Step 3: Identify relevant data
Data quality is the single biggest determinant of MMM output quality. Clean, consistent, logically stored data saves weeks of preparation. Enlist colleagues responsible for your data repositories. A step-by-step process for turning raw data into actionable insight covers the data-preparation discipline MMM depends on.
Step 4: Understand your data access and limitations
Create an inventory of the data you hold and want to involve, including payments or subscriptions required for third-party data, and any delays associated with offline data retrieval.
Source: iab
How to conduct marketing mix modelling?
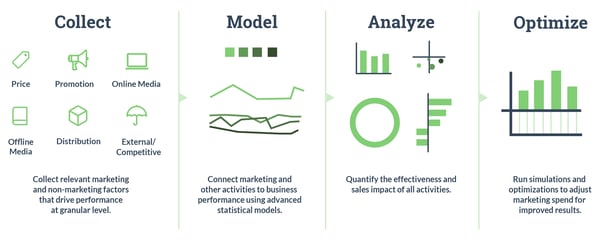
Nielsen points to 4 stages of the Marketing Mix Modelling process:
Source: Nielsen
Stage 1: Collect
Within the collection stage of marketing mix modelling, econometric techniques are used to estimate product demand produced by marketing tactics by separating product sales into 2 types of sales drivers:
1. Incremental drivers, the controllable elements implemented by the marketing team, captured week-to-week:
- Above-the-line: TV, print ads, digital ads, broad promotions, discounts.
- Below-the-line: Temporary selling prices, sales promotions, social media, direct mail, in-store marketing, events, conferences.
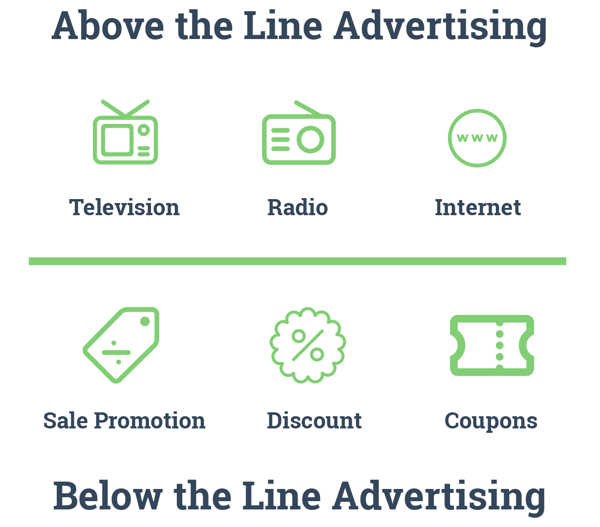
2. Base drivers, sales that would be achieved without any incremental marketing activity. Base drivers are usually the result of brand equity and reputation built over years, including customer loyalty:
- Price: Determines which consumer segment the product reaches and which promotions apply.
- Distribution: Store locations, in-store stock, and shelf life, static factors customers encounter without marketing intervention.
- Seasonality: Periodic variations that drive predictable sales. In 2018, for example, ecommerce grew 16.7% in the holiday period, reaching $123.90 billion.
- Macroeconomic variables: Inflation, GDP, unemployment, and other broad economic indicators that shift baseline consumer spending power.
Source: Exl Service
Stage 2: Model
P.M Cain calls time-series regression analysis the logical choice for marketing mix modelling projects. The approach breaks the campaign history into intervals of time and corresponding business results, then models the relationship between the two.
Most modern MMM implementations also build on the concept of Adstock, a theory from 1979 describing the non-linear relationship between advertising and consumer behaviour. Adstock states that advertising has diminishing returns and a lingering effect: Its influence decreases over time but does not drop to zero immediately. Time-series regression combined with Adstock lets marketers understand both the peak impact window and the long tail of a campaign.
Modern Bayesian MMM frameworks (Meta's Robyn, Google's Meridian) have replaced the pure classical regression approach for most teams. Bayesian models let analysts encode prior knowledge, "we know TV usually has an 8-week decay curve", producing more stable models when data is limited or noisy. The underlying principles remain Adstock and time-series regression; the modern implementation is just more flexible.
Stage 3: Analyse
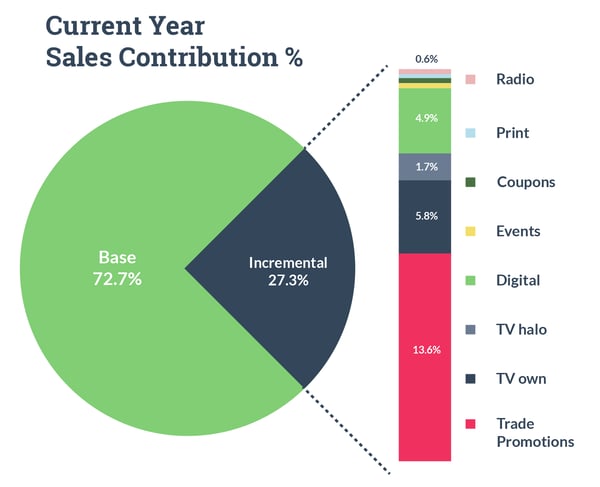
The outputs are examined in the form of a decomposition of sales, breaking the result down into volume for each modelled tactic. There are three significant metrics for analysing the decomposition:
- Effectiveness: How much sales uplift each tactic produced.
- Efficiency: How much uplift per pound spent.
- Median Return on Investment (MROI): The central tendency of the return distribution for each tactic.
The analysis works at both the whole-portfolio level and the individual-tactic level. The 40 KPIs most relevant to marketing teams typically sit alongside MMM outputs to give executives a full performance picture.
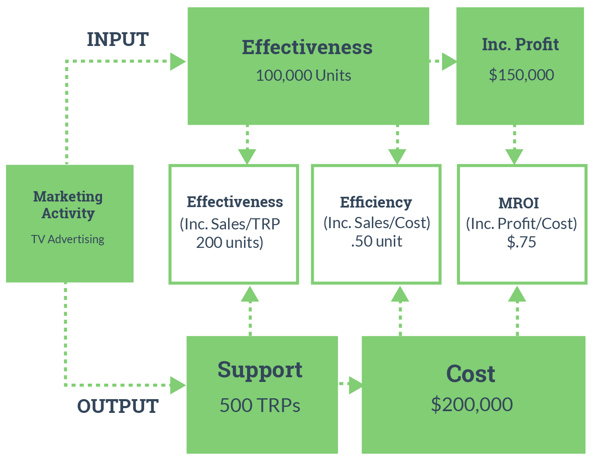
Source: Neilsen
Stage 4: Optimise
This final stage turns outputs into inputs. The model's equations describe the relationship between marketing activities and sales results, which means the team can run "what-if" simulations before committing budget.
Example: "What if we decrease the price of a product by 5%?" The model returns a quantified estimate of the sales impact. The same approach handles channel reallocation ("what if we move 20% of TV budget to CTV?"), seasonal planning, and competitive response scenarios.
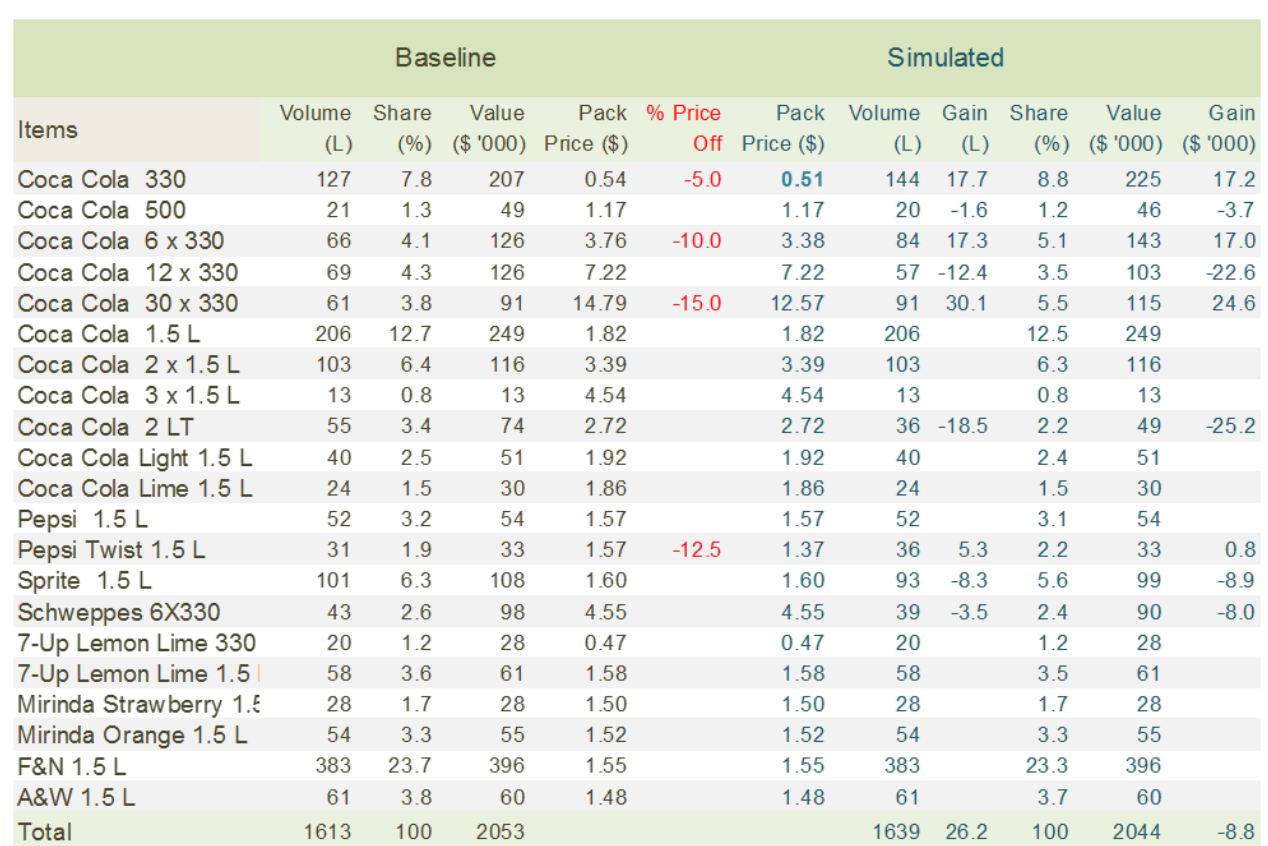
Source: Ashokcharan
The modern MMM tools and platforms for teams
The MMM software market has expanded dramatically since 2020. Options now fall into three distinct categories, each suited to a different type of team:
|
Category |
Representative platforms |
Best for |
Typical investment |
|---|---|---|---|
|
Enterprise MMM vendors |
Nielsen, Analytic Partners, Kantar, Marketing Evolution, IRI |
Large organisations with multi-channel spend across TV, digital, and retail media |
High (£100K+ annually) |
|
Open-source frameworks |
Meta's Robyn, Google's Meridian, Uber's Orbit, LightShed |
Teams with in-house analyst capacity who want control and iteration speed |
Low (analyst time + infrastructure) |
|
Self-serve SaaS platforms |
Rockerbox, Northbeam, Triple Whale, Prescient AI, Recast |
Mid-market and ecommerce brands wanting MMM without a long implementation |
Mid (£3-15K monthly) |
The right choice depends less on brand name and more on three practical questions: Does your team have an analyst who can own a Bayesian model? How much offline spend sits in your mix? And how quickly do you need to iterate on the model as the market shifts?
How AI and machine learning are reshaping MMM
AI has changed what MMM programmes can produce and how often they can refresh. Five shifts matter most:
- Bayesian priors replace brute-force regression: Modern frameworks (Robyn, Meridian, LightShed) let analysts encode prior knowledge, producing more stable models with less data.
- Automated refresh cycles: AI-driven platforms re-run MMM weekly or even daily rather than quarterly, giving marketers near-current rather than retrospective guidance.
- Scenario simulation at scale: Generative AI tools produce dozens of "what-if" scenarios automatically, comparing budget allocations and channel mixes in seconds.
- Hybrid MMM + MTA models: Machine learning now bridges aggregate MMM outputs with user-level MTA signals, reconciling the two methods rather than forcing a choice.
- Natural-language querying: Modern platforms let marketers ask "what happens if I move 20% of TV spend to CTV?" and receive an instant modelled answer, lowering the analytics bar for non-technical users.
Measuring the return on these AI capabilities is itself a growing discipline, Hurree's framework for measuring the ROI of AI in marketing covers how teams justify the investment and how they build on the broader principles in AI-driven business success.
Industry-specific MMM applications
The core framework is universal, but the shape of each MMM programme shifts by industry:
|
Industry |
Dominant spend |
What MMM is most used for |
|---|---|---|
|
Retail and CPG |
TV, OOH, retail-media networks, seasonal promotions |
Channel allocation across online and offline; promotion effectiveness |
|
Ecommerce |
Paid search, paid social, email, influencer |
Post-privacy budget allocation; reconciling attribution gaps |
|
Financial services |
Direct mail, TV, long-cycle digital |
Channel mix within strict compliance; retention vs acquisition balance |
|
B2B |
LinkedIn, content, events, ABM |
Brand-plus-pipeline measurement; long sales cycle attribution |
|
Media and streaming |
TV, digital, performance acquisition |
Brand build vs performance balance; subscriber acquisition efficiency |
Adapting MMM to industry-specific dynamics is what separates a report that produces insights from one that produces action.
Real-world MMM examples
Three illustrations of MMM producing measurable change:
- Procter & Gamble: Shifted meaningful spend from TV to digital after MMM-driven reallocation across its brand portfolio, publicly attributed with improved marketing efficiency.
- Spotify: Uses MMM to balance podcast advertising, display, and TV, reconciling what MTA could not measure after iOS 14.5 restrictions.
- Netflix: Uses MMM alongside incrementality testing to balance brand marketing, performance acquisition, and originals promotion across a global budget.
The pattern is consistent: MMM for strategic allocation, MTA for tactical digital decisions, incrementality tests to validate specific claims.
Choosing a marketing mix modelling vendor
Unless you have the in-house statistical expertise to run modelling yourself, the vendor choice determines the quality of the output. During vendor evaluation, Nielsen recommends asking five questions:
- Question 1: Which sales drivers are included in the marketing mix model?
- Question 2: How is data collected?
- Question 3: What level of granularity are the data inputs?
- Question 4: How do you ensure the accuracy of the data inputs?
- Question 5: How granular are the insights?
Without thorough investigation, you risk an analysis that lacks creativity, runs overtime with unplanned delays, or in the worst case produces inaccurate data that fails to drive the actionable insights you need to increase revenue and ROI.
Make every marketing pound work harder
Marketing Mix Modelling has moved from a specialist tool used by TV-heavy consumer brands to a core measurement capability for any serious marketing team. Three structural shifts, privacy regulation, cookie deprecation, and the open-source MMM revolution, have made it faster, cheaper, and more accessible than it was in 2020, and more necessary than it has ever been.
If executed well, MMM streamlines the marketing mix through fact-based optimisation. It removes guesswork, improves ROI through precisely allocated budgets, and accounts honestly for seasonal and channel-specific effects. In marketing, accurate measurement creates room for better creative, sharper customer experience, and more confident strategic moves.
Modern MMM programmes also sit alongside, not against, multi-touch attribution and incrementality testing. The best 2026 measurement stacks run all three.
Frequently asked questions
What is marketing mix modelling in simple terms?
MMM is a statistical method that uses historical sales and marketing data to measure how much each marketing activity contributes to business results, then uses the model to forecast and optimise future budget allocation.
What is the difference between MMM and multi-touch attribution?
MMM is a top-down statistical model using aggregated data over long periods. MTA is bottom-up user-level analysis that credits individual touchpoints in the digital journey. Modern teams run both alongside incrementality testing rather than choosing between them.
What are the main benefits of MMM?
Proving marketing ROI across all channels including offline, optimising budget allocation across the full mix, forecasting sales with full context, and producing a measurement method that is resilient to privacy and cookie changes.
What are the main limitations of MMM?
Lower cadence than real-time digital analytics (though modern frameworks run weekly), inability to measure individual customer journeys, and dependence on substantial clean historical data.
How much data does MMM need?
Typically two to three years of weekly marketing spend and sales data across every channel in scope, plus external variables such as weather, macroeconomic indicators, and competitor activity. Bayesian frameworks reduce the data requirement when prior knowledge is encoded.
How is AI changing MMM?
AI enables automated model refresh, Bayesian frameworks that need less data, instant scenario simulation, hybrid MMM and MTA models, and natural-language querying that lets non-technical marketers interrogate the model directly.
Why has MMM become more popular since 2020?
Three privacy shifts (iOS 14.5, third-party cookie deprecation, GDPR enforcement) have degraded user-level attribution. MMM uses aggregated data and is largely immune, making it a privacy-resilient alternative.
What tools are used for MMM?
Enterprise vendors (Nielsen, Analytic Partners, Kantar), open-source frameworks (Meta's Robyn, Google's Meridian, LightShed), and self-serve SaaS platforms (Rockerbox, Northbeam, Prescient AI, Recast).
How does incrementality testing fit alongside MMM?
Incrementality tests are controlled experiments with a holdout audience. They provide a clean causal read on specific channels or campaigns, validating or correcting what MMM and MTA models claim.
Which industries benefit most from MMM?
Retail and CPG, financial services, ecommerce, B2B, and media and streaming all see meaningful returns. Each industry weights the methodology differently based on dominant spend categories.


Share this

The 7Ps of The Marketing Mix: Streamline your Strategy

Experiential Marketing: 4 Es to Future-proof Your Strategy