When it comes to organising and analysing data, the benefits of using a dashboard cannot be overlooked. By providing a clear, visual representation of data, a dashboard will highlight overall progress towards key goals. Whether it’s a campaign specific dashboard, overall company health dashboard, or a sales analytics dashboard, the main goal is to provide a highly visual, quick display of data used for decision making, empowering employees and measuring overall performance towards a goal. In this blog, we will dive deeper into some of the benefits of dashboards and discover how to determine which KPIs and metrics you should include on your dashboard.
What is a dashboard?
Just like a car dashboard highlights problems with the cars performance, an analytics dashboard will do the same for your business or campaigns on one panel. Instead of seeing an engine warning light or fuel empty symbol though, you will see numbers, values, charts and graphs, and from this you can decipher what is performing well and what areas need improvement.

A good dashboard guides you to do more of what’s working and less of what is not by pulling in data from numerous sources and platforms, and presenting them in one place. So your marketing dashboard might pull in data from your email marketing platform like MailChimp or Klaviyo, your website's performance from Hubspot or Google Analytics, your social media metrics from LinkedIn and Facebook, and your sales data from Shopify.
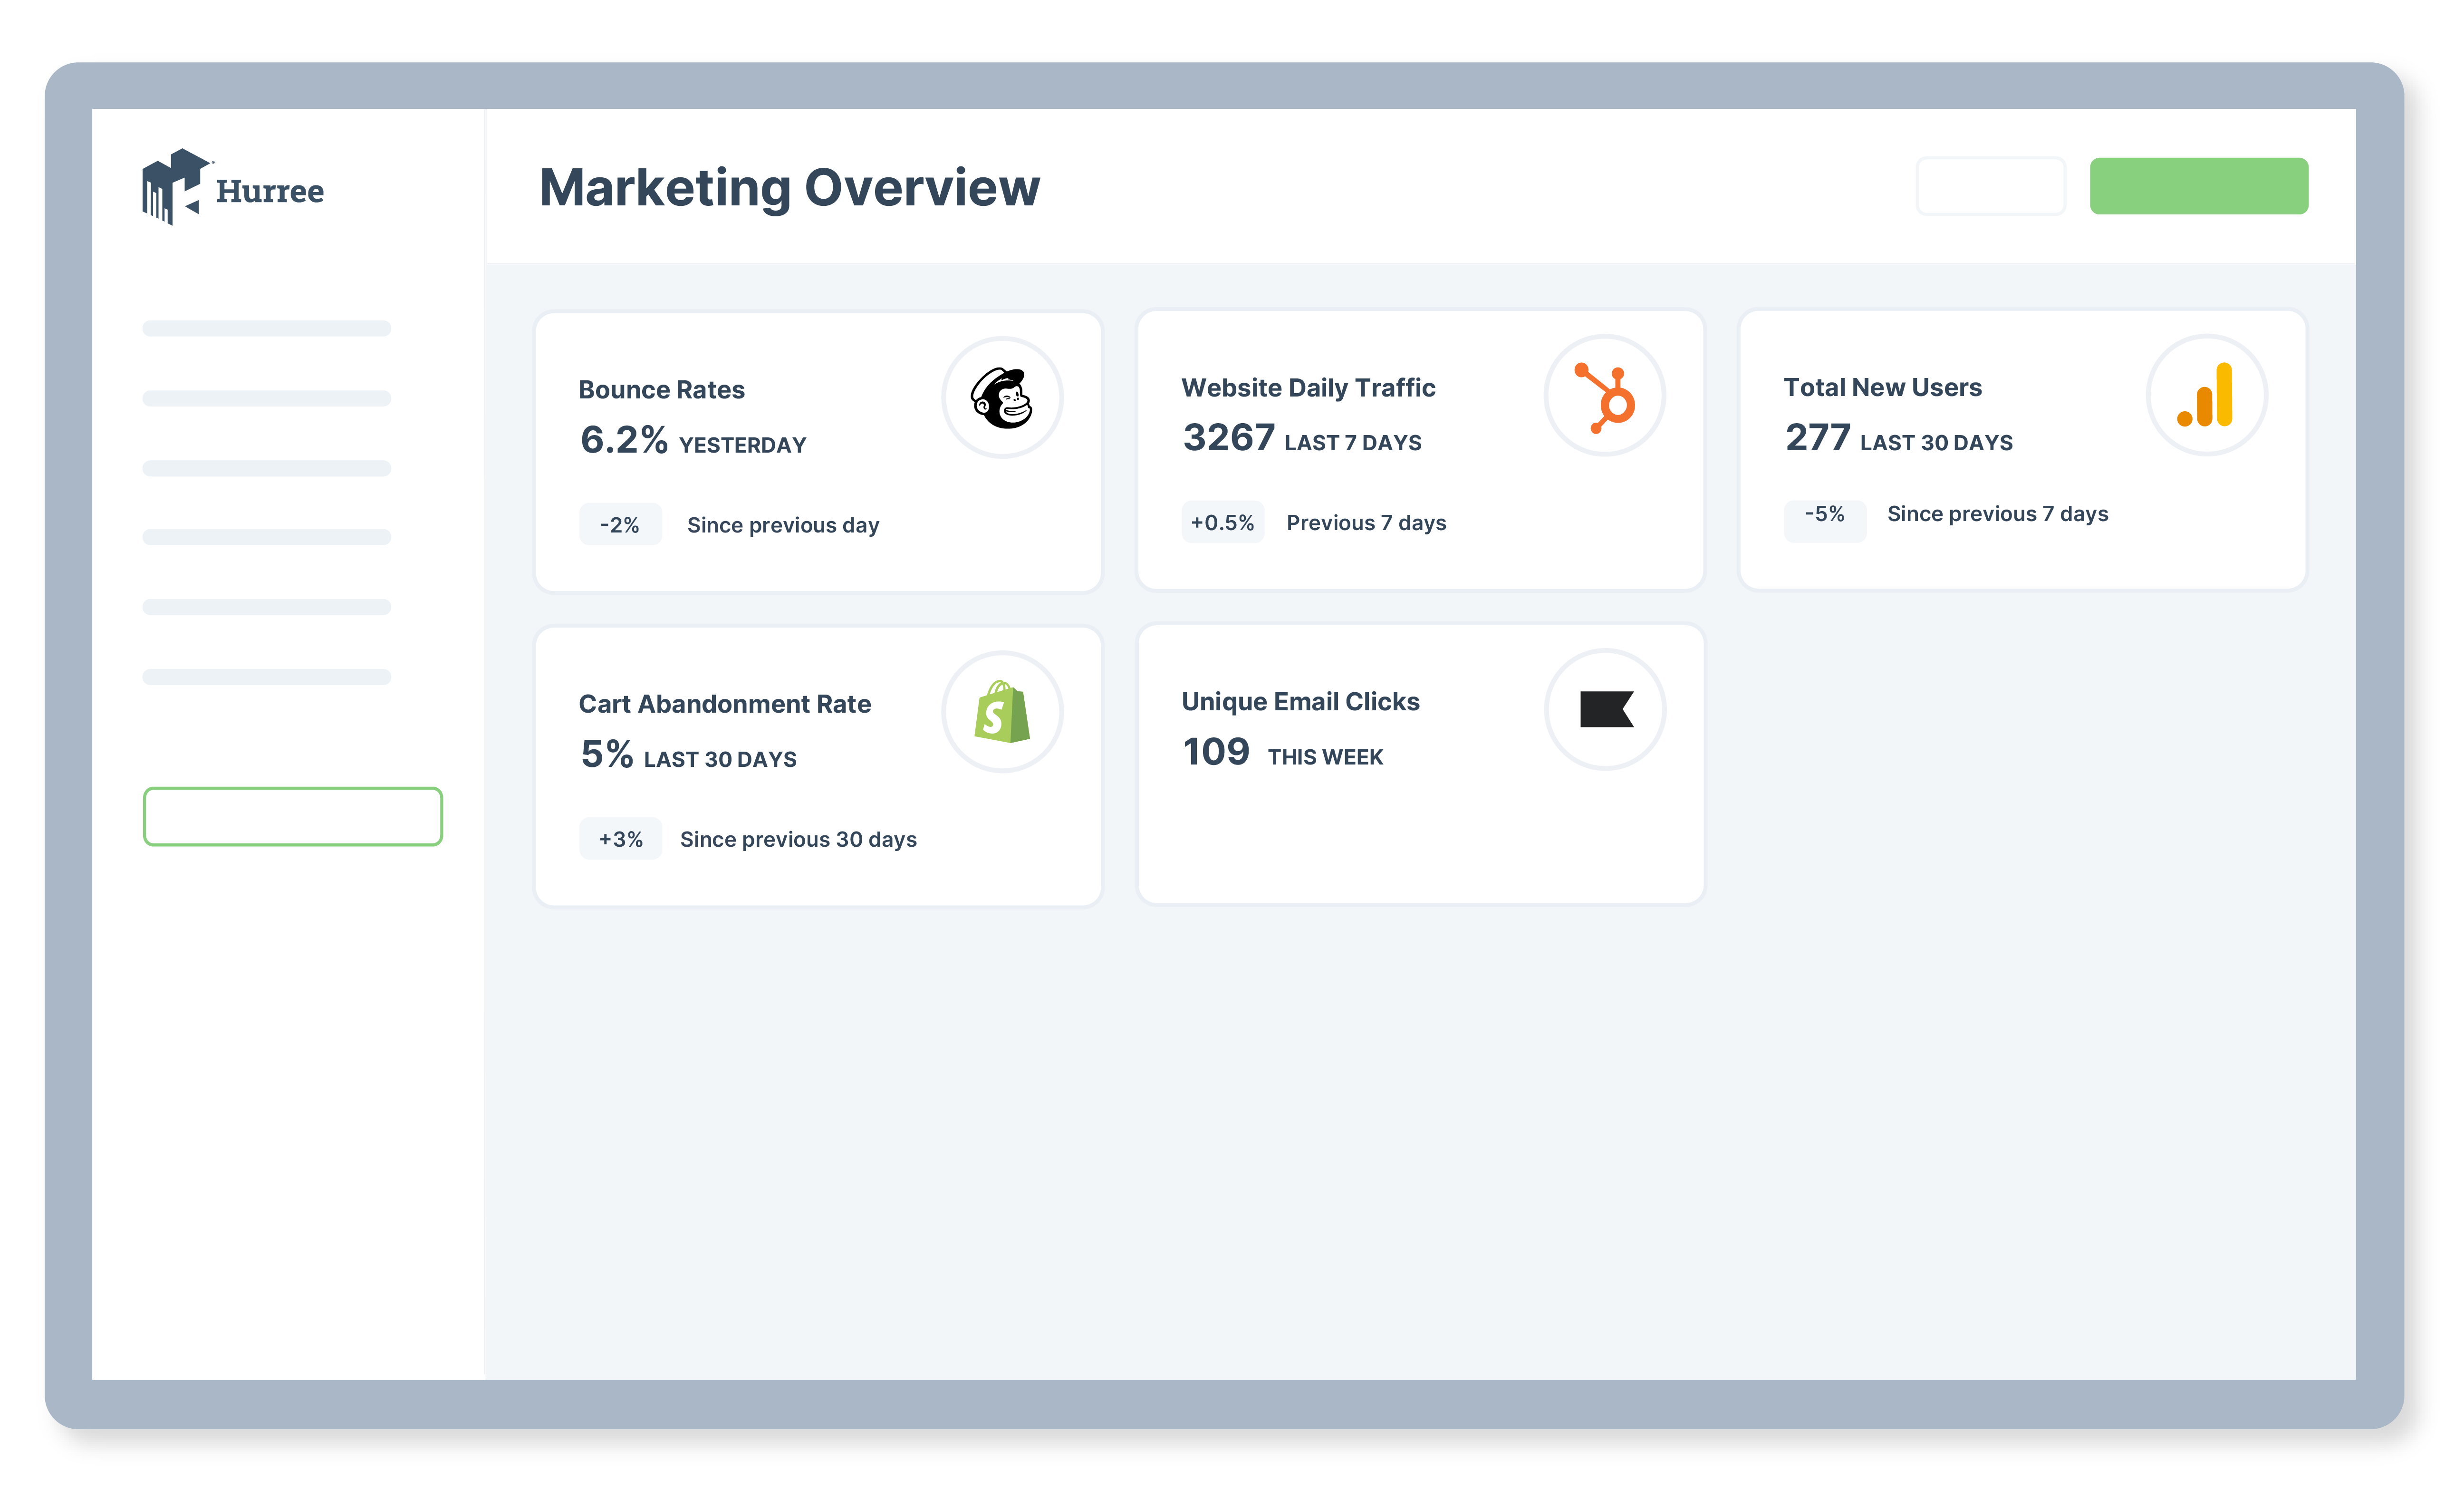
Hurree Marketing Dashboard Example
Think about the amount of time you would spend manually going into each of these platforms and exporting the data for a report. The beauty of a dashboard is that once it’s connected to your tools, the data will automatically populate in close to real-time. Other benefits of using dashboards include:
- Improving communications and data visibility between teams and departments
- Identifying areas for improvement
- Spotting patterns and trends in historical data
- Allowing you to tracking the most important KPIs in one place
In order to get the most from your dashboard, you need to know how to determine what data to include, and for many this can be the tricky part as there is so much data out there. It’s easy to get sidetracked with KPIs and metrics that aren’t important, making it difficult to determine what truly matters for your team or business. Here are our top tips to consider when choosing which KPIs to include on your dashboard:
1. Consider the audience
Dashboards can often be set up without a user in mind. Depending on who is using the dashboard, it’s crucial to include the KPIs that will be of most benefit. Think about the purpose of the dashboard, who it’s for and what you want them to do differently because of it.
Take a marketing dashboard for example. While there may be many departments viewing the dashboard, like the sales team, the finance team and the management team, the main user of the marketing dashboard is the marketing team (the clue is in the name), so it makes sense to only include the KPIs most relevant to them. The purpose of the dashboard is to track the marketing team’s performance through clear data, facilitate decision making and plan future marketing strategy.
While it might be useful for the marketing team to know the current sales pipeline and number of sales closed this quarter, that data doesn’t actually provide the marketing team with value to shape the marketing strategy and might overwhelm the team with data, potentially even distracting the team from focusing on the most important data.
2. Choose relevant KPIs
A dashboard must measure something meaningful and should be directly linked to your main goals and objectives. Start with a clear understanding of key business objectives and goals, and use this to decide what KPIs are needed that clearly show progress towards those goals. If the KPIs are not relevant, then they are quite literally a waste of space on your dashboard.
If a KPI has been created using the SMART technique (specific, measurable, achievable, relevant and time-bound), then you’re off to a flying start as they will already have been created with your main goals in mind. If you’re not sure how to create SMART KPIs, ask yourself the following questions:
- What is your overall goal or target, and how will you measure it?
- How will you know if/when you’ve reached your goal?
- What types of values or measures will provide you with the evidence to show that you are on track to achieving your goals?
- Where will you collect the data?
Learn more about how to create SMART KPIs here.
KPIs are only useful when they show what your specific indicators of success are in a way that can actually be measured. So if one of the main objectives is to grow the business, then you will want to ensure all of the KPIs on your dashboard relate directly to this goal. You might want to include sales revenue, net profit, monthly recurring revenue or number of active customers. All too often, dashboards can quickly turn into a dumping ground for any and every KPI, but just because it can be measured, doesn’t mean it should be.
3. Avoid vanity metrics
Vanity metrics are the KPIs that look good at a glance but don’t offer much of an impact on your strategy. While they initially may seem impressive, they can actually be misleading as they provide no real insight into how your business or team is performing overall. One way to identify a vanity KPI is to ask yourself the following questions:
- Will the metric lead to a decision or course of action? If the answer is no, then it’s likely that the KPI is a vanity metric.
- Can the results of this metric be easily reproduced in the future? If the answer is no, then again it’s likely that the KPI is a vanity metric.
- Is the metric accurate and does it tell the full story? Yep, you guessed it - If the answer is no, then it’s probably a vanity metric.
An example of a vanity KPI is the number of app downloads. Yes, it’s nice to monitor this regularly, but including it on your dashboard doesn’t really give much valuable insight. This is a number that will always grow, so in theory it seems encouraging but by itself it doesn’t give any real value.
4. Include KPIs that are automatically populated
One of the main benefits of a dashboard is that they are highly efficient by saving you time and effort by automatically consolidating multiple data sets into a single, user-friendly interface. This means you will no longer have to manually calculate and input data yourself. But if you choose KPIs that are coming from a platform or channel that is not connected with your dashboard, then you will need to manually calculate and enter the data directly.
Inputting data this way greatly increases the chances of human error occurring, especially when copying and pasting data in different formats from various platforms. If users are making decisions based on the dashboard, then those decisions could be based on incorrect data.

Source: Harvard Business Review
Dashboards are intended for rapid consumption so should update fast and often. Manually inputting data may result in a lag, especially if the person in charge of updating the data is off work or simply forgets to update the dashboards. If the manual KPIs haven’t been updated, the data quickly becomes unreliable and outdated, making it difficult to accurately assess or analyse the data.
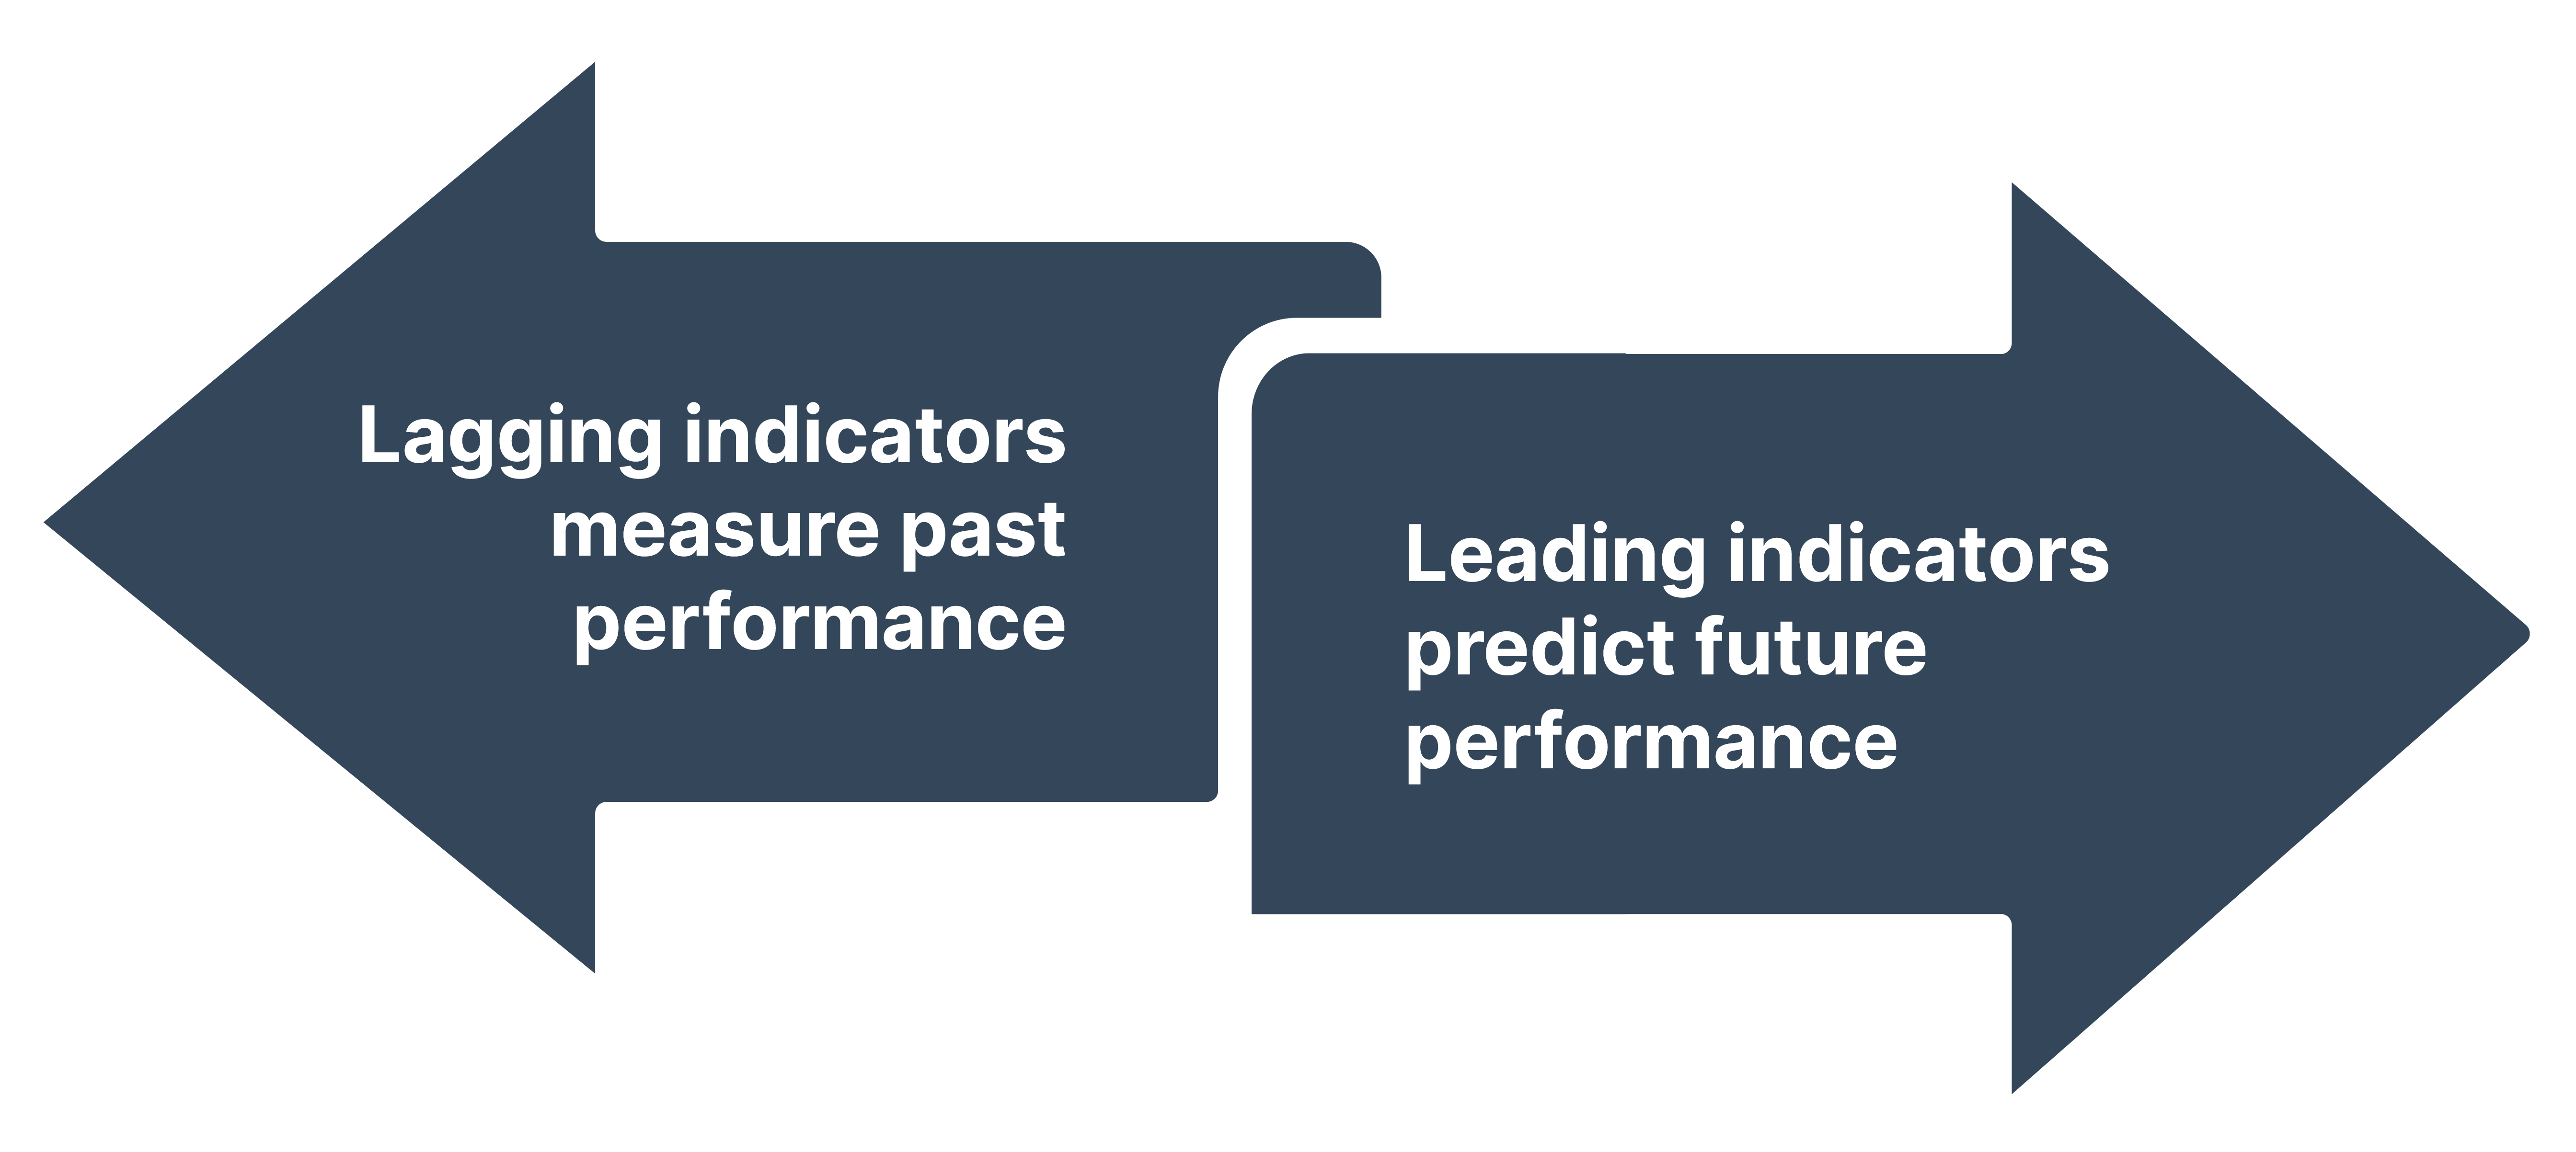
5. Include both leading and lagging KPIs
The whole point of a KPI is to highlight performance and track progress towards an intended result or goal. Basically, they are how teams track their performance but there are different types of KPI that should be included in your dashboards to get the most value. So to get a much better shot at success, it’s best to know how you’ve performed previously, and how you are performing now. To do that, you should include both leading and lagging KPIs.
A lagging KPI is backwards looking, showing what has already occurred to gain insights for future success. Leading KPIs on the other hand are forward looking and help ‘lead’ to success by meeting overall objectives. They highlight if you are currently on track and help you plan ahead to reach the goals. Say for example, you are a sales rep and your goal is to increase sales. For your leading indicator, you could include new opportunities and the number of calls, meetings and demos you’ve got planned, and your lagging indicator could be total sales, revenue or closed won opportunities.
Conclusion
It isn’t always easy to find the right KPIs for your dashboard but once you have, you will be able to see the bigger picture much more clearly. Every business will have different goals and objectives, with different KPIs to measure performance. The trick is to keep these in mind at all times, along with who will be the main user of the dashboard, what they want to use the dashboard for and ensuring the dashboard is integrated with the right tools. From sales and customer service, to HR, accounting and more, every department can benefit from seeing their data on a dashboard, as long as it’s the right data.


Share this

Guide to Ecommerce Dashboards

7 Sales Dashboards Your Sales Team Needs (With Examples)