Email marketing is one of the more traditional aspects of digital marketing. To some, it might seem a bit more old school compared to the fast paced and ever changing landscape of social media, video and digital marketing. But in spite of the rising popularity of other methods, email marketing still remains one of the most effective ways to reach your customers and generate revenue.
The first ever email marketing blast was sent in 1978 (crazy, right?) and has stood the test of time for good reason. Email marketing is 40% better at converting customers, compared to social media channels like Facebook or Twitter, and with 99% of email users checking their inbox every day (some checking it 20 times a day) email marketing is certainly not a channel to be ignored. Think about the last time you opened an email or checked your inbox. We’ll hazard a guess it was probably pretty soon after you woke up, and then probably again during your coffee break or at lunch…are we close?
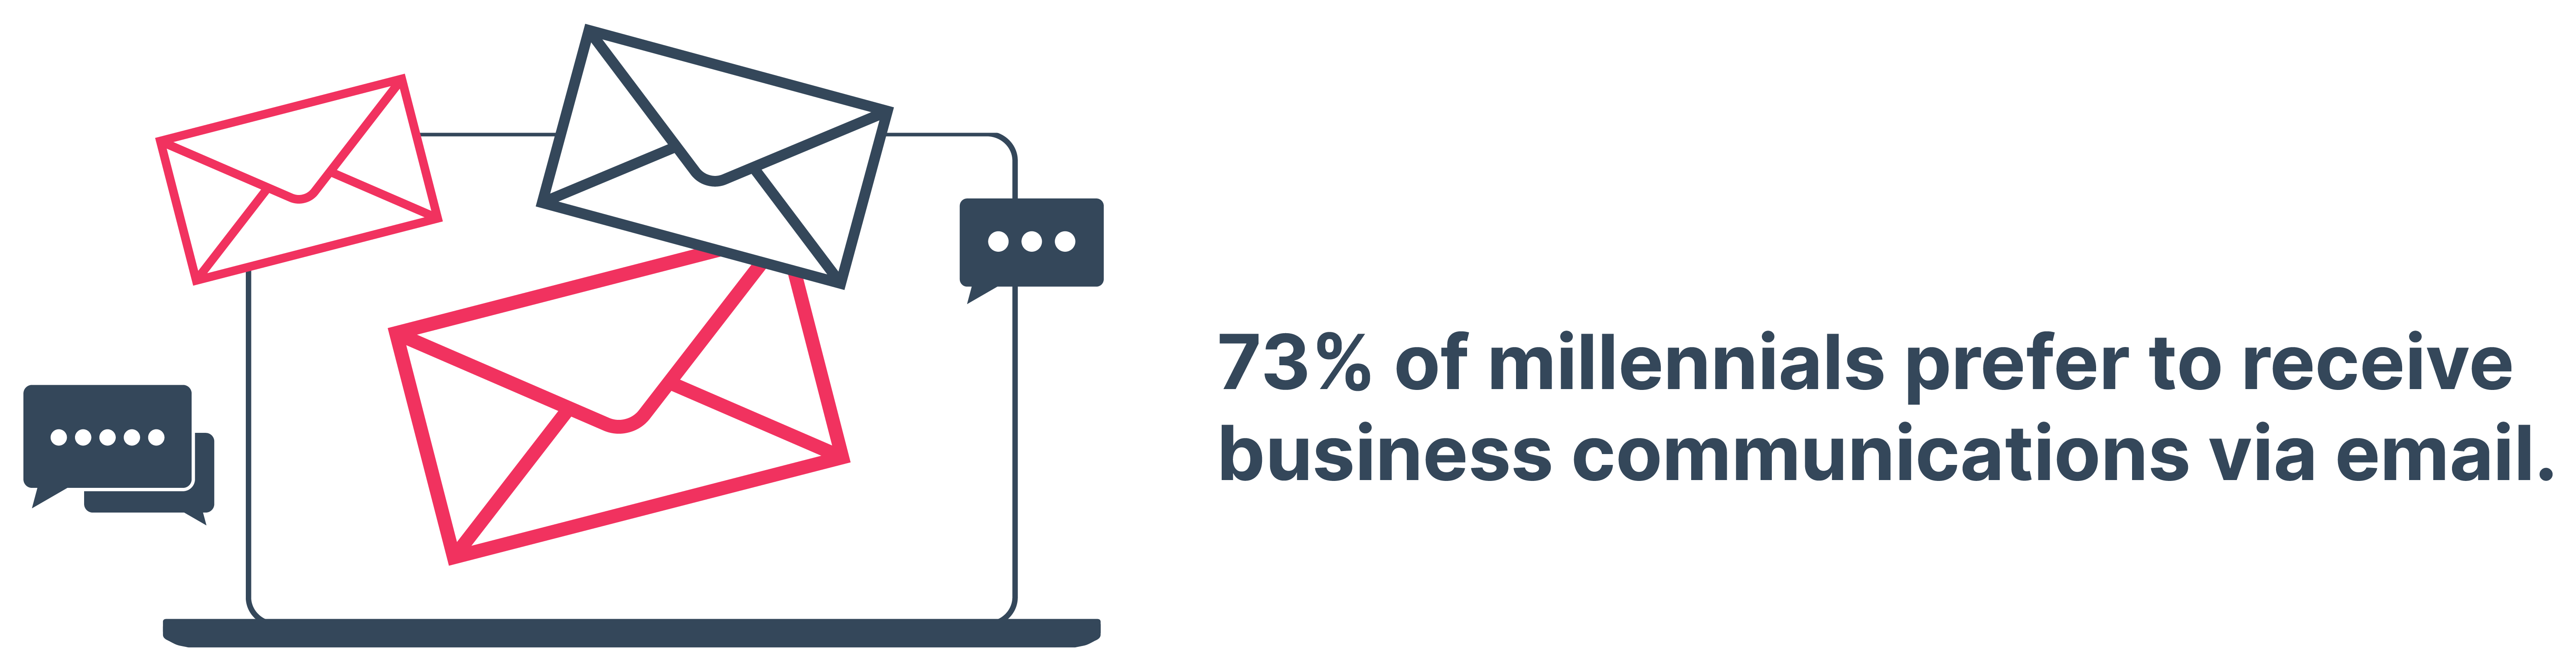
Source: HubSpot
However, it can be difficult at times for marketers to fully assess their email marketing performance with so much data on offer. That’s where an email marketing dashboard can help.
Benefits of an email marketing dashboard
Email marketing dashboards are a great way to display, measure and track the most valuable data for your email marketing and will give you the key data to assess how close you are to achieving your email marketing goals. Visual dashboards will typically contain graphs, charts, maps and more, to communicate the data of your customers, your campaigns and your team's performance.
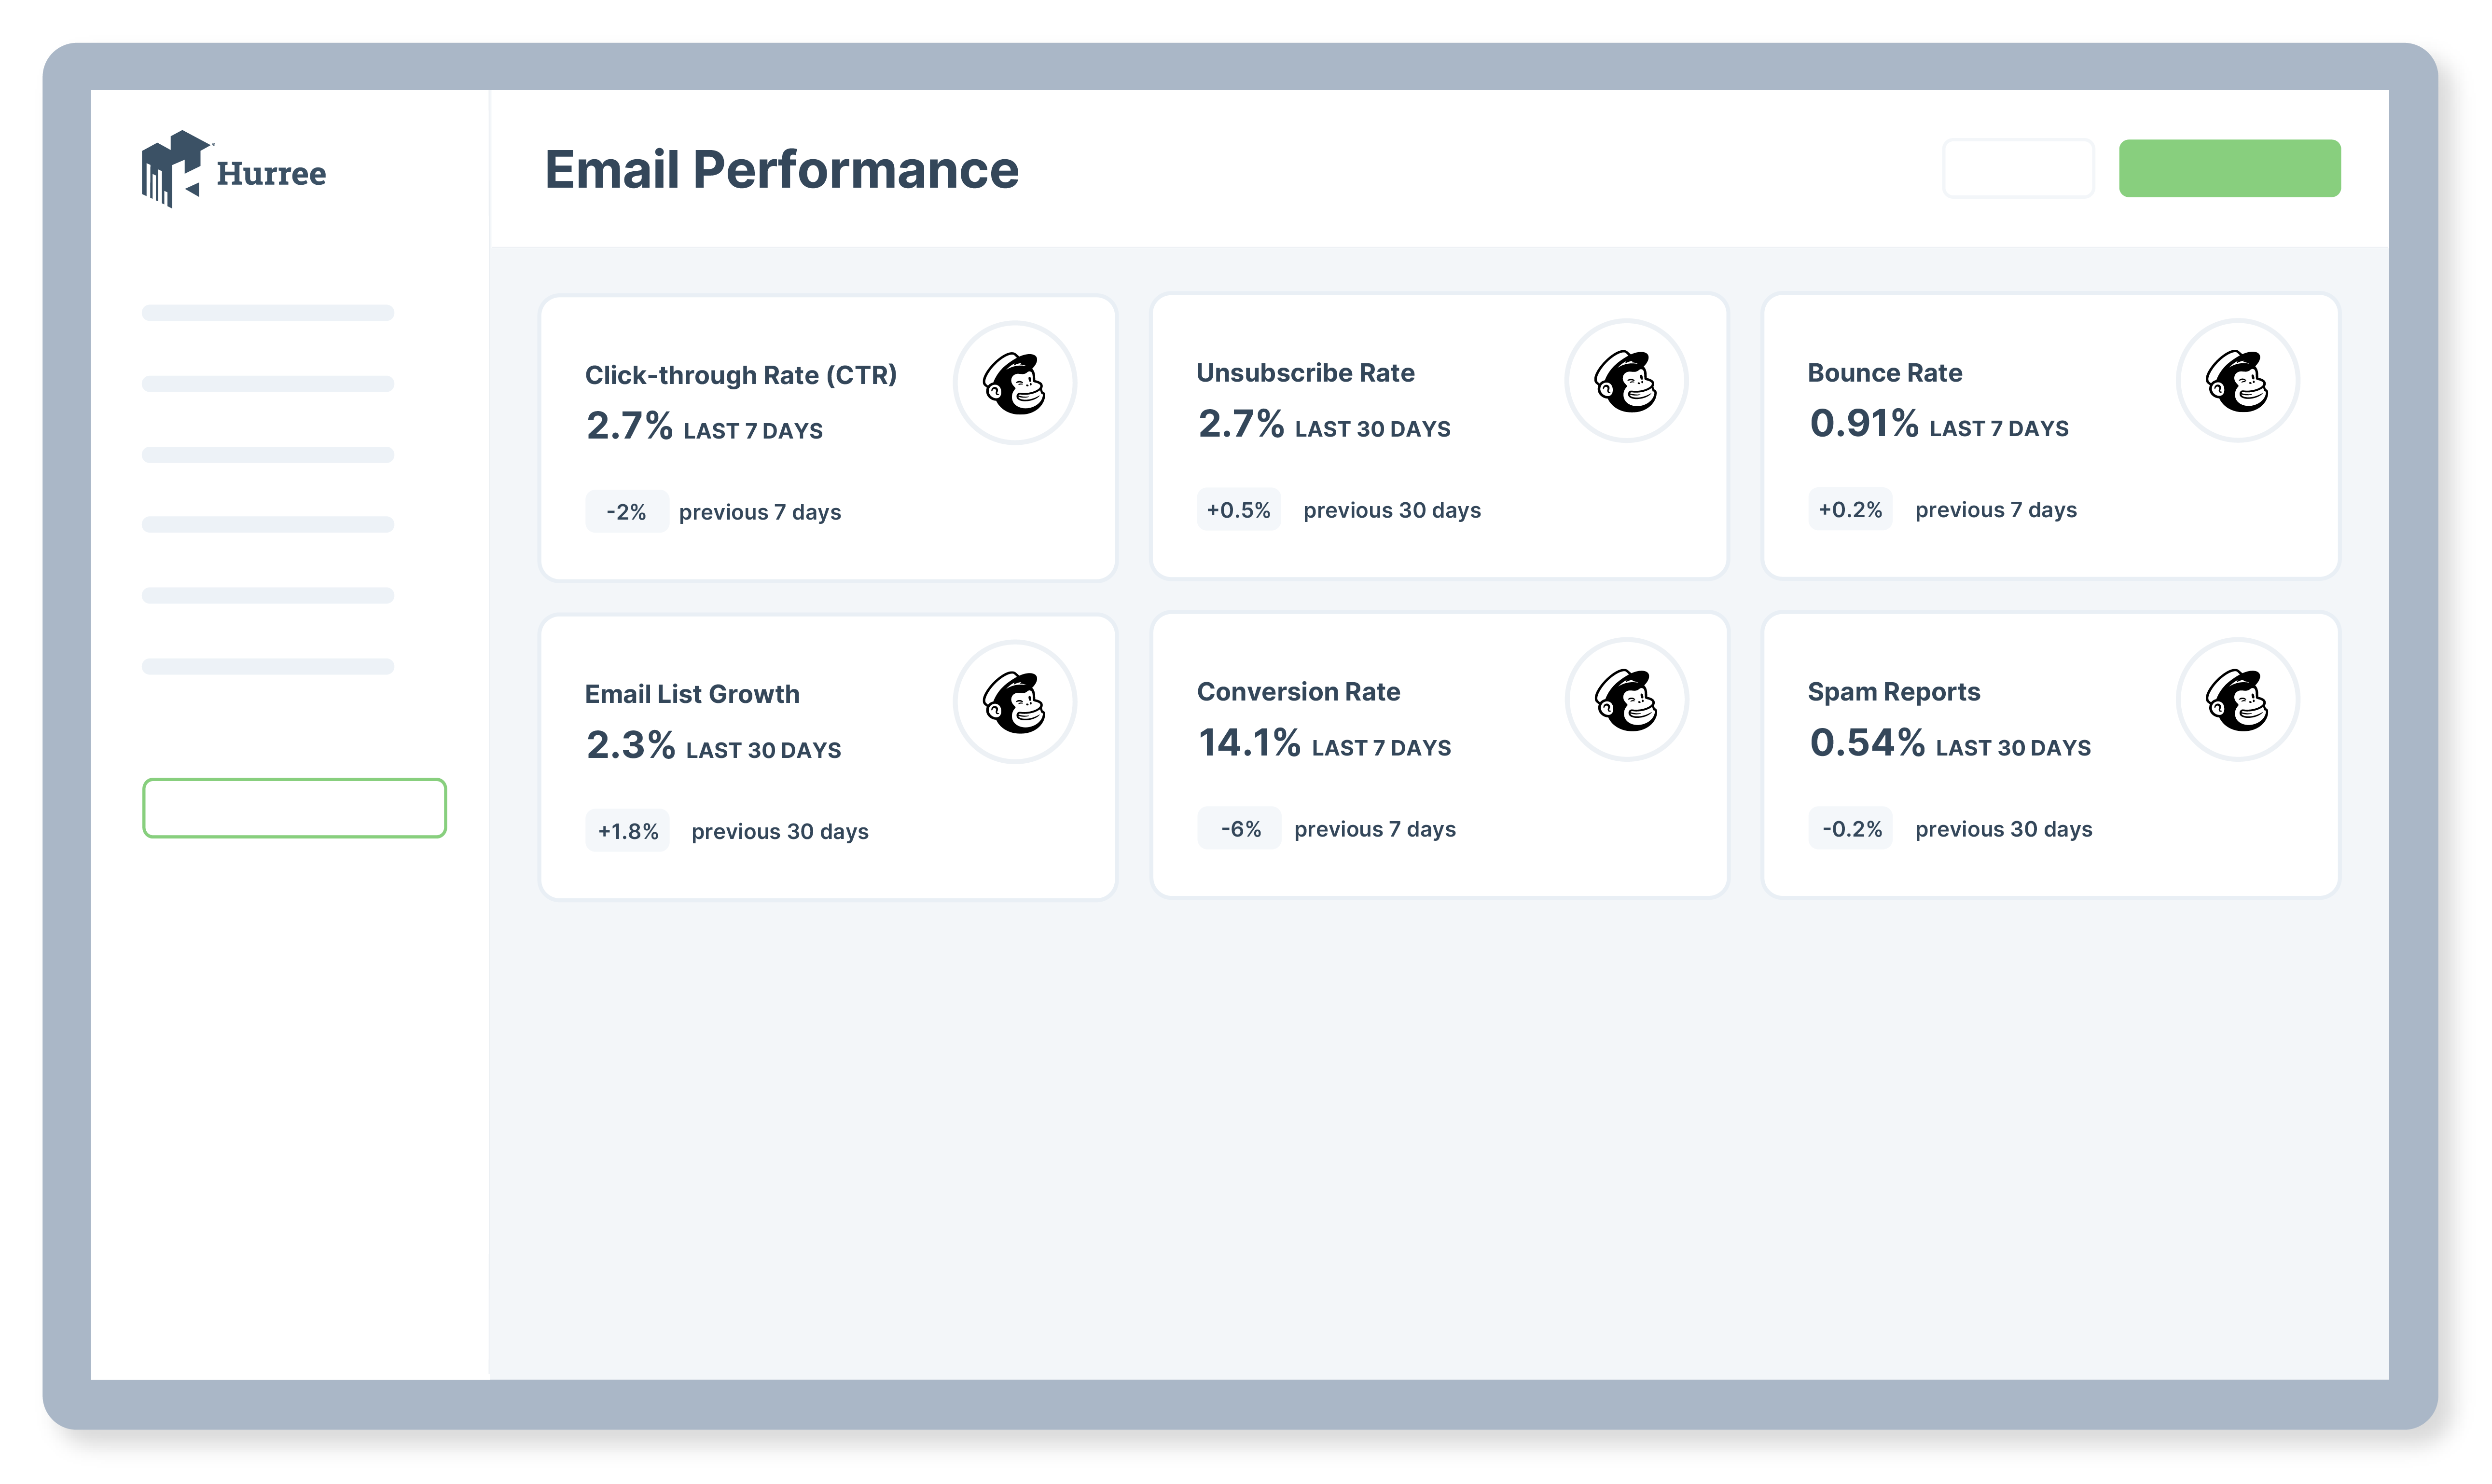
Hurree Dashboard Example
A well designed email marketing dashboard has several benefits:
- Enables an at-a-glance understanding of performance of your campaigns, saving valuable time by replacing the creation of manual reports.
- Facilitates a framework for easy identification of success and highlights poor performance, giving you a chance to tweak, edit and improve.
- Aligns the entire department around the most valuable metrics, with clearly visualised progress tracking and growth possibilities.
- Integrated visualisations make forecasting for future marketing strategies more efficient and accurate.
- Allows you to share dashboards with your team instantly through a link or email, allowing for quicker and easier communication.
What to include in your email marketing dashboard?
Your dashboard should show you all the most important data for your campaigns. The majority of dashboards are updated regularly, giving you up to date, accurate data. Before creating your dashboard, you should consider the goals of your email campaign. Is it to generate revenue, distribute new content, drive traffic to your website or nurture your existing subscribers? Once you have determined your goals and objectives, you can start deciding which metrics will be most relevant to include to show overall success and progress towards your goals. While there is no ‘one size fits all’ approach as each dashboard should be specific to each business, here are a few basic metrics to keep in mind.
1. Click-through rate (CTR)
This is one of the most common metrics to determine how well a campaign is performing. It measures how many recipients have clicked on the links within your email. So say you successfully deliver 10,000 emails and 1,000 people clicked at least one link in the email, your click through rate would be 10% (1,000 / 10,000 x 100%). CTRs are typically lower than open rates, with an average CTR just above 2%. While open rate is often the top metric on every marketer's list for tracking the effectiveness of emails, subject lines and best times to send email campaigns, they are now very unreliable. New updates to email clients means marketers no longer have trustworthy data on how many of their contacts have actually opened their emails. Measuring the click-through rate will give you a more reliable and better understanding of what types of content resonate more with your subscribers.
2. Conversion rate
The conversion rate is the number of users who have done exactly what you wanted them to do - they have opened your email, clicked your call to action, and converted. Every email you send should have a specific goal or objective, otherwise what is the point in sending it? Not every email will lead to a sale, but you still want each email to include a compelling call to action. This doesn’t necessarily have to be buying a product, it could be completing a lead generation form, signing up for a product demo, or downloading an ebook. The higher the conversion rate, the better.
3. Bounce rate
There are two types of bounce rate in email marketing: hard and soft bounces. Hard bounces are when an email is not delivered as the email address is incorrect or non-existent. Soft bounces are caused by a temporary problem, for example when the email recipient's inbox is full. Having too many hard bounces can affect your sender reputation and will negatively affect your email effectiveness as the ISP (Internet Service Provider) may categorise your emails as spam, meaning those who actually want to receive your emails may not. Monitoring this data gives you an overall indication of the health of your email list. Some email marketing platforms also have pricing tiers based on the number of emails sent and the number of contacts, so having a large number of incorrect or invalid email addresses will end up costing you more money.
4. Unsubscribe rate
Any email marketing platform will tell you how many people have unsubscribed upon receiving your email. Like bounce rate, having a high unsubscribe rate can be harmful to your domain and can put you at risk of being blacklisted. Recipients should be given the option to opt out of emails completely or update their email preferences in relation to frequency and the type of content they want to receive. Many subscribers may not bother going to the effort of unsubscribing, but instead will stop opening your emails altogether, so it’s important to consider open rate and engagement together when looking at this metric.
Source: HubSpot
It can be discouraging to see a high unsubscribe rate, but as mentioned above, having a lot of users on your list who are no longer interested may cost you money in the long run. Tacking unsubscribes might highlight patterns or trends in your strategy. For example, if you increase the frequency of your emails and see the unsubscribe rate increase, it might suggest that you are sending emails too often. Think about the number of times you subscribe to an email list, only to unsubscribe a week later after receiving an email every single day…it can definitely get annoying.
Related reading: How to decrease inactive users with email marketing
5. List growth rate
This is used to determine the rate at which your email list is growing. It’s normal to see peaks and troughs and most email lists will naturally experience some attrition every year, so focus on ways to engage new subscribers, re-engage old subscribers and attract new loyal subscribers. The main trend you want to see with your list growth rate is one that is increasing over time. It’s important to consider this alongside click through rate and conversion rate. Having a large number of subscribers is great, but if none of them are engaging with you or buying from you, then the figure becomes redundant and nearly meaningless.
6. Spam complaints
Often considered as one of the most important metrics to keep a close eye on, spam complaints will have a significant impact on your email marketing deliverability. Spam complaints are reports made by email recipients against emails they don’t want to receive. When a user marks your email as spam, it signals to inbox providers that they aren’t interested in your emails, and the next email you send will likely end up in their spam folder. Say you sent a campaign to 5,000 email addresses and got 10 spam complaints, your spam rate would be 0.2% (10/5000 x 100%). Aim for a spam complaint rate of less than 0.05%. If your spam rate gets too high, your email service provider may take action and suspend your account or block your emails completely. There are various ways to decrease spam complaints including:
- Ensure your email unsubscribe link is easily accessible in every email
- Enable double opt-in
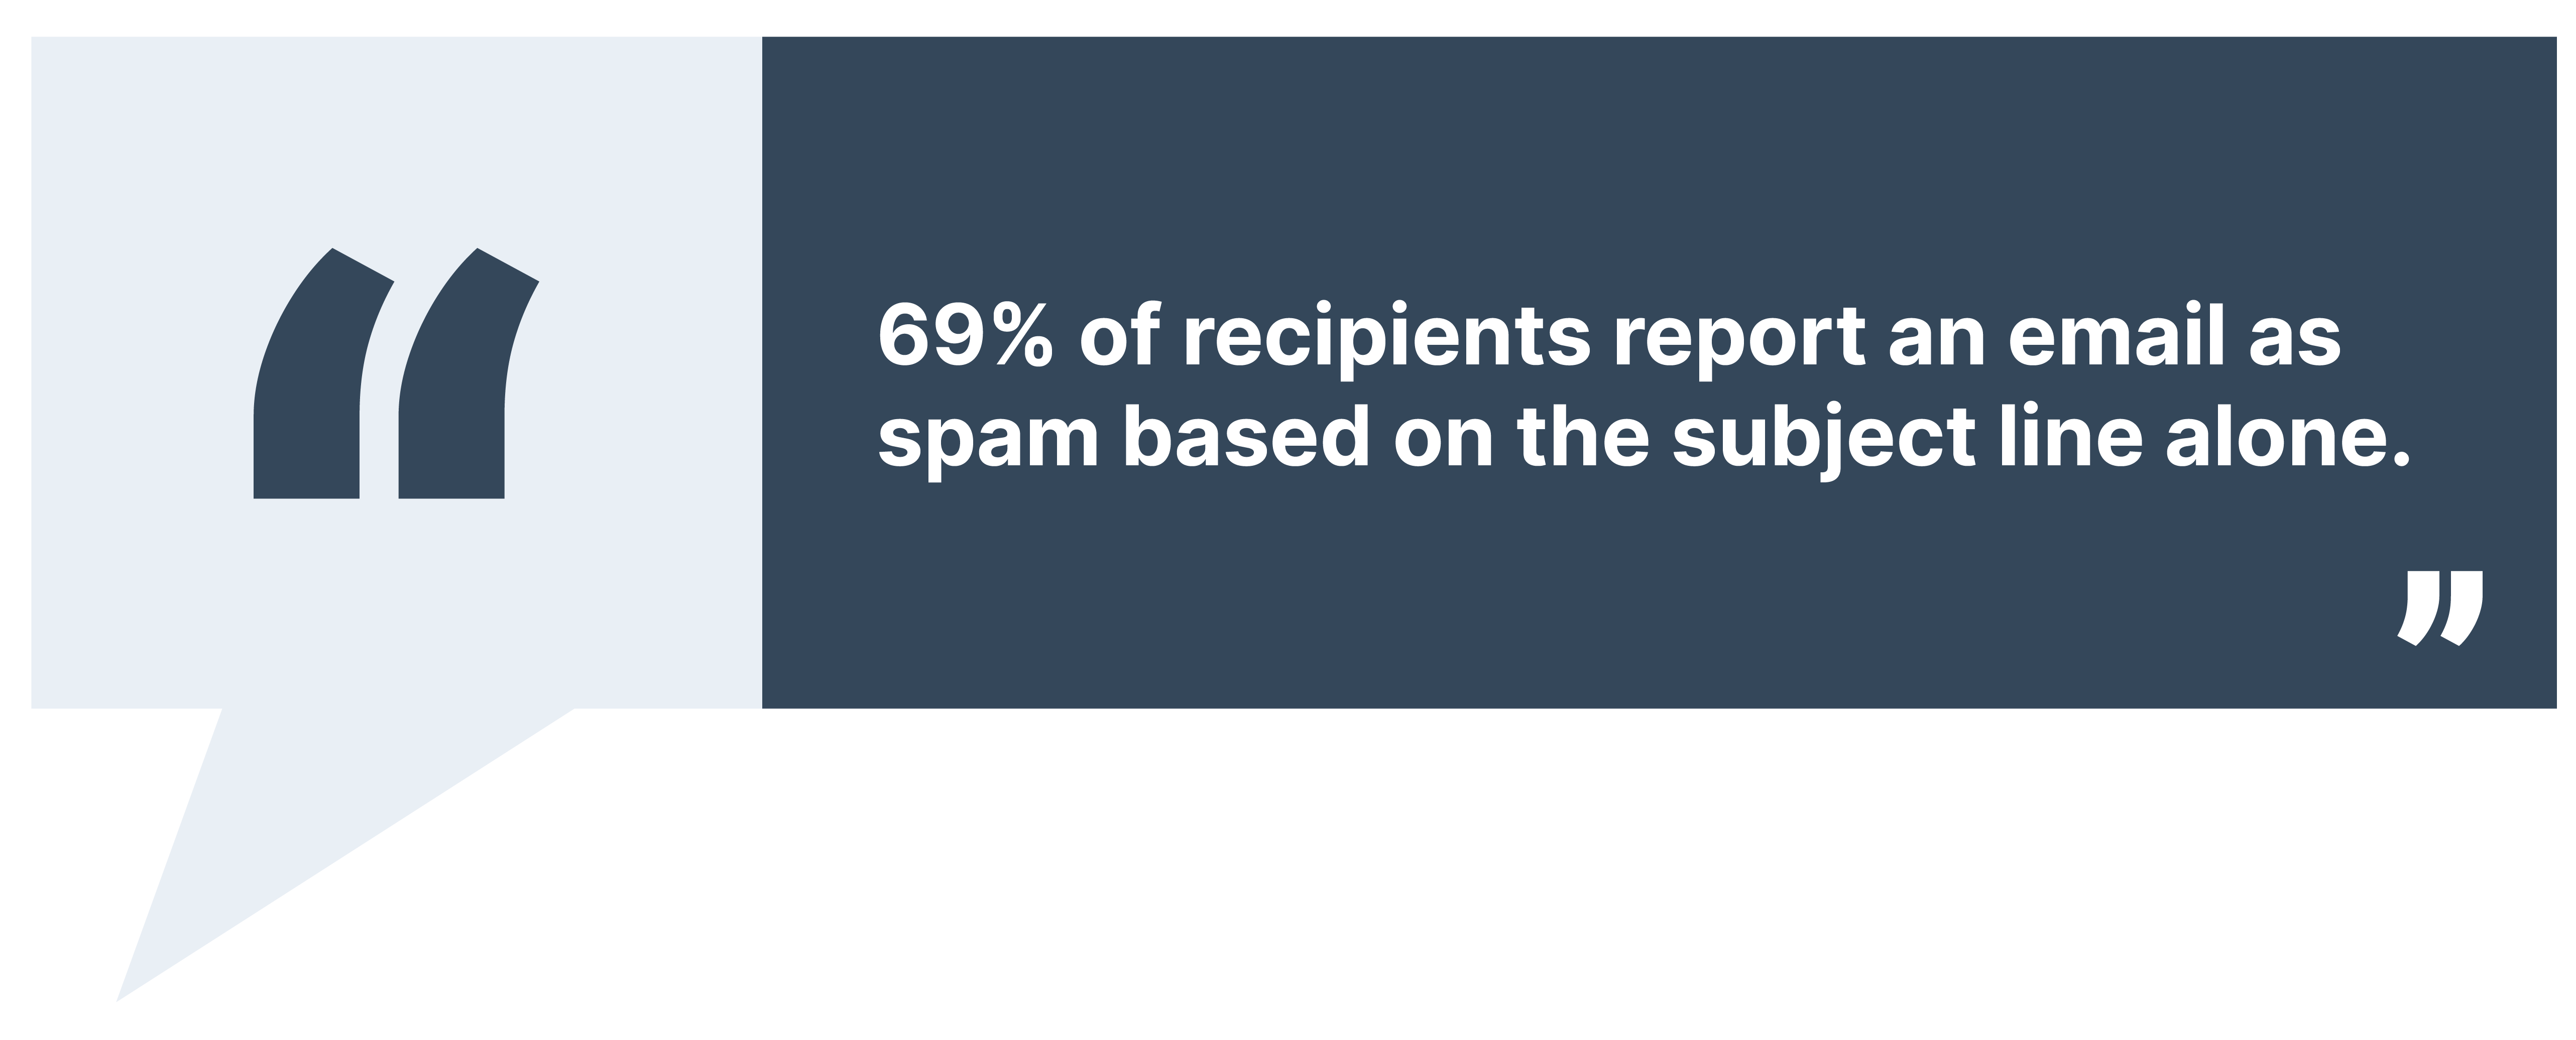
- Avoid using spammy subject lines e.g ‘IMPROVE YOUR GOOGLE RANKINGS AND MAKE ££££!! TAKE ACTION NOW!’
- Ensure emails come from the same domain as where your recipients signed up
Source: Invesp
Conclusion
Whatever email marketing platform you are using, keeping an eye on how your emails are performing is crucial. If you don’t monitor them, then you don’t know if your hard work is paying off. Likewise, you won’t know what’s not performing well, meaning you won’t know where and why improvements need to be made. Plans for measuring, evaluating and analysing should be at the forefront of all your email marketing campaigns, and deciding which metrics to include on your dashboard that will provide the most value to you is critical. Using the metrics above, and other others that you deem insightful will keep your campaigns on track and help to provide success to your email marketing strategies long-term.
What KPIs should marketers be tracking to really make an impact? Our guide breaks down the 40 best KPIs that marketers should measure to maximise their efforts. Download your free copy today and discover the KPIs that will help you measure the true value of your marketing activities.


Share this

How to Choose the Right KPIs for Your Dashboard

7 Sales Dashboards Your Sales Team Needs (With Examples)