There is a truth that is universal - all businesses, big or small, want to increase conversions. And it’s a huge business in and of itself - companies spend an average of $2000 per month on conversion rate optimisation (CRO) tools because even a slight increase in that ever important number can mean massive increases in ROI.

When most people think of CRO, tools like HotJar, Crazy Egg, and Google Opitmize come to mind. However, you don’t always need to spend thousands on software to increase your conversion rate. Data is the key to any successful goal, and conversions are no different. The idea, then, is to figure out what data will provide you the full picture you need to make effective and efficient decisions. Tracking the right KPIs is the first step, so we’re going to outline the right ones to track to provide you insight and context to send those conversion rates sky-high.
But first, let’s go over some of the basics.
What is a conversion?
That all depends on what your end goal is, but in general a conversion is when a lead or contact takes an action to push them further along the sales journey.
A website conversion, for example, is when someone lands on your website and fills in a form. They convert from web visitor to lead. If they then move through the sales funnel and eventually make a purchase, they have converted into a customer.
You can then further break down conversions into macro conversions and micro conversions. Macro conversions occur when a user completes a major end-goal action. The types of macro conversion that provide insight include:
- Trial sign-ups
- Demo requests
- Form fills
Micro conversions, on the other hand, are the smaller steps along the user journey. Think of actions like viewing your pricing page, watching a product video, or adding something to their cart. We’ll get into a bit more detail below, but these types of conversions can show you specific areas where your website, content, or sales funnel is working (or not).
Once you have a contact’s information, a conversion can then be progressing through each stage of the sales funnel. For example, if a contact moves from Marketing Qualified Lead (MQL) to Sales Qualified Lead (SQL), that counts as a conversion. The ‘most important’ conversion for any business though, is that which leads to a purchase. Some companies will track lead to customer conversion rate, others will focus more on MQL or SQL to customer (quality over quantity).
As you can see, at every stage of the sales journey, increasing conversions is an important goal for any business. No matter how well you’re doing, ensuring you have an effective sales funnel that converts prospects efficiently at every step is crucial.
But just measuring conversions as a standalone KPI doesn’t really provide you with the information you need to make improvements. Without context, it means almost nothing other than as a performance indicator. So what KPIs will provide you a fuller picture? Read on to find out.

1. Website: Visitor to contact rate
This may be a duh moment, but it’s important to start with your base KPIs in order to know where you are and decide where you want to be. The visitor to contact rate represents the number of people who land on your site vs the number of people who provide you their contact details, whether in a chatbot, form, or email.

It’s an important indicator of overall website health and can be a barometer for whether the right audience is landing on your site.
Having high traffic but a low contact rate could mean a few things:
- It’s hard to contact you
- Your CTAs and messaging isn’t compelling
- You’re not targeting the right audience

Source: Wordstream
Addressing these issues will certainly help increase your overall conversion rate, but using more contextual data will allow you to hone in on areas of opportunity.
2. Returning visitors
For similar reasons, returning visitors are also an important KPI to track. In fact, measuring your returning visitors is almost like measuring conversions themselves. Coming back to your site is essentially micro conversion, or at least a pre-conversion. This KPI can give you great insight into how your website as a whole is performing. While it won’t let you narrow down the successful pages specifically (we’ll get to that later), it does show you whether people actually come back to your site.

Source: Adobe
When combined with things like A/B testing, tracking returning users can show you what sort of material your audience responds to, which can inform your future plans.
3. CTA click rate
Now we’re starting to look at KPIs that can narrow down any issues or opportunities. A CTA click rate is the percentage of people who have seen your call to action vs the number of people who actually click on it. In this case, when we say CTA, we mean buttons or links to actions.

The CTA click rate shows you pretty starkly whether your CTAs are working or not. And in the world of conversions, clicking on a CTA is of the utmost importance because it is the step (usually) just before the actual conversion. If people are not clicking on your CTAs then your conversion rate is unlikely to increase.
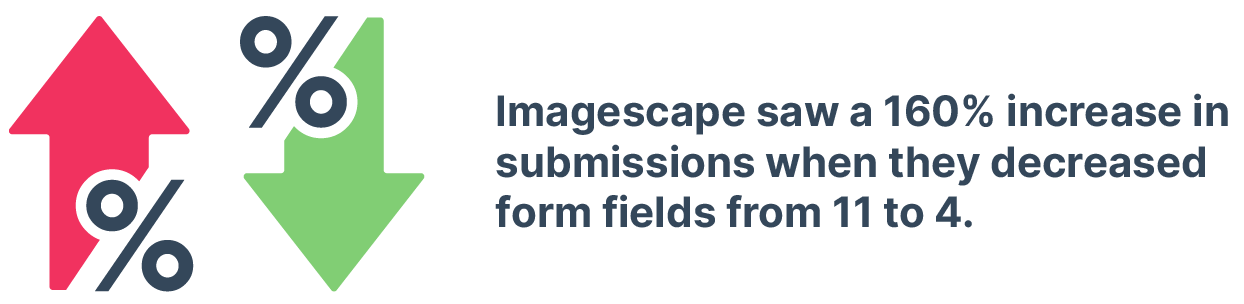
4. Form fill rate by page
A lot of people like to measure the overall form fill rate however I think it’s more important to see the number of form fills by page. Seeing what pages have high-performing forms can provide great insight into whether your content is working and also if the form itself is built for conversions.
Ask yourself this - is there anything different about the forms on your high performing and low performing pages? Are the form fields different? Do you ask for a phone number on one and not the other? Knowing the answers to these questions can help you make improvements to the pages and forms, and hopefully increase that all important conversion rate.
Source: LinkedIn
5. Click-through rate (CTR)
Like the term conversion itself, CTR can mean a few things. In this case, however, we’re looking specifically at the CTR from organic and paid search results. CTR here means the number of clicks a search result receives, divided by the number of times it's viewed. You’ll have different stats for paid and organic search, but both are equally as important to track.
A low organic CTR can be an indicator that you’re not ranking for the right keywords, and having a low CTR here can actually impact your overall SERP rankings.

Source: Backlinko
It’s very similar for paid search, and can mean that you are putting money into keywords or campaigns that aren’t right for you. Or perhaps your ad CTAs and messaging just aren’t hitting the mark. Either way, paid and organic search are important elements in driving quality traffic to your website (which should, in turn, increase your website conversion rate).
5. Bounce rate
Bounce rate is the percentage of web visitors that leave a webpage without taking an action, this includes clicking onto another page of your website. Essentially, it’s the percentage of your traffic that only views a single page. Why is this important for conversion rate? Quite simply, if a person bounces off your site, they won’t convert. Even clicking through to another page signals intent or that your content is leading them further along the user journey.
Tracking your bounce rate and then working to lower it should, theoretically, drive up your conversions. At the very least, it will have a knock-on effect of driving up stats like CTA click rate or form fills. And if you’re already using data to address those areas, your conversion rate shouldn’t be long after.
6. Email marketing performance
Did you know that for every $1 spent, email marketing generates $36? That’s a huge ROI and shows that email marketing is a big driver of conversions, no matter the stage of the customer journey. But it’s only effective if you get your email marketing right, and the first step in doing so is benchmarking your email marketing performance.
Within email marketing, there are individual KPIs you can measure to provide an overall picture of email health:
- Open rate: percentage of email recipients that have opened the email
- Unsubscribes: how many email recipients have unsubscribed?
- Click-through rate: out of the total amount of emails delivered, how many recipients clicked through the email?
- Deliveries: how many emails were sent vs how many were actually delivered?
- List growth: is your contact list growing?
Tracking these metrics can show you things like the quality of your contact list, whether your messaging is clear and working, and if your overall email strategy is moving contacts towards purchase. All of which have a direct impact on your conversion rate.
7. MQL to SQL rate
While you can measure the conversion rate between any lifecycle stages, the MQL to SQL rate is particularly important for marketers. This is calculated by dividing the number of SQLs by the number of MQLs over a set period of time (most will track monthly). This is an important KPI as it tells you whether or not you have generated quality MQLs.
As a marketer, I’ll tell you a secret - depending on the criteria you use, MQLs aren’t always the best indicator of qualified leads. While most marketers will do what they can to ensure MQLs are high quality, the best way to measure this is to measure how many MQLs actually progress to the next step of the journey.
This allows you to see the quality of the leads (obviously), but also shows that your content is working and for the right audience.
8. SQL to opportunity rate
While the above is important for marketers, the SQL to opportunity conversion rate is crucial for sales teams. You calculate this by dividing the number of opportunities by the number of SQLs in any given time frame.
SQL to opportunity is a great way to gauge your sales process and whether it’s functioning properly. If you have a high MQL to SQL rate but a low SQL to opportunity rate, it likely (though not always) means there is an issue within the sales process that needs to be addressed.
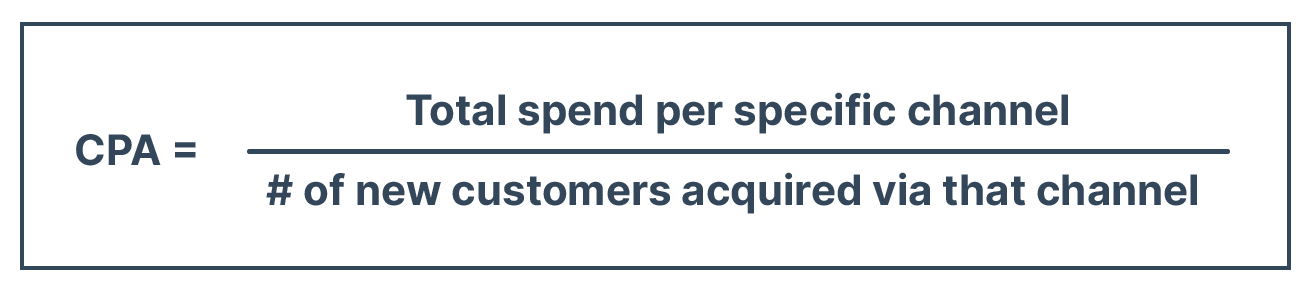
9. Cost per acquisition
Cost per acquisition (CPA) is the cost of acquiring a new customer. It helps you measure the direct impact of marketing and sales on revenue, which can help provide context to your overall conversion rates.
You can measure this by channel (paid social, PPC) or look at the overall rate. The former, though, will provide a more detailed picture of how each channel is working, and when paired with the size of the deals associated with each channel, you can see if that investment is worth it. It can also help identify efficient channels that you can put more effort and resource into.
Tracking the right KPIs on a comprehensive dashboard, as we can see, provides a detailed overview and critical context to your overall conversion rates. It’s almost impossible to drive higher conversion rates without knowing the performance of the different channels and touch points of the user journey. Otherwise, you’re making decisions that are uninformed and unfocused.
The next step on your journey to higher conversion rates is finding the right tools to track your data. Did you know that you can try Hurree for free, no credit card required? Get started now to see how you can track your KPIs and supercharge your conversion rates.


Share this

How to Combat Shopping Cart Abandonment: 7 Actions
5 Metrics You’re Not Tracking That Will Kill Client Retention