Unlocking the potential of your marketing efforts requires more than just intuition; it demands data-driven insights. Enter the marketing dashboard: a powerful tool that empowers businesses to monitor, analyze, and optimize their marketing performance in real-time.
But what exactly is a marketing dashboard and what should you include to make it effective? Read on and we’ll delve into the essential components that make up an effective marketing dashboard, exploring why it’s a key tool for businesses striving to make data-driven decisions.
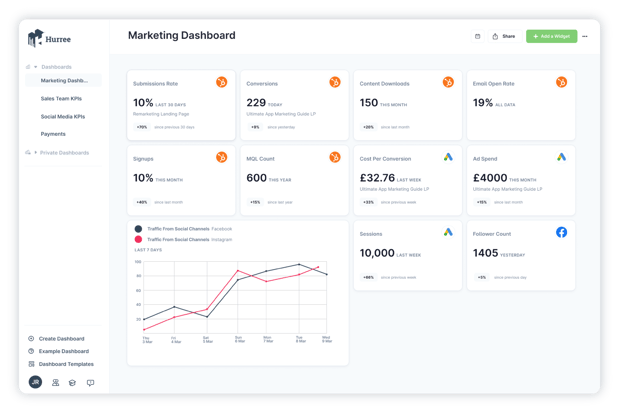
What is a marketing dashboard?
We’ve written about this previously, but essentially a marketing dashboard is a visual representation of key performance indicators (KPIs) and metrics related to marketing activities and campaigns. It consolidates data from across your tech stack - from website analytics and social media platforms to email marketing tools and advertising platforms - into a single interface.
What are marketing dashboards used for?
Marketing dashboards serve a number of purposes, but most importantly, they provide businesses and stakeholders with near real-time insights into the performance of their marketing efforts. By tracking KPIs such as website traffic, conversion rates, engagement metrics, and ROI, marketing dashboards help businesses make data-driven decisions, optimize their marketing strategies, and allocate resources more effectively.
Here are some other reasons why teams and businesses use marketing dashboards:
- Centralizing data for clarity: One of the primary purposes of a marketing dashboard is to centralize data from various channels and platforms into a single, easily accessible interface. Whether it's website analytics, social media engagement, or email campaign performance, a well-designed dashboard provides marketers with a comprehensive overview of their efforts.
- Up-to-date insights for agile decision-making: Timing is everything. A marketing dashboard offers up-to-date insights into campaign performance, allowing you to identify trends, spot opportunities, and address issues promptly. This agility is crucial for adjusting strategies on the fly and capitalizing on emerging opportunities.
- Measuring KPIs: Every marketing campaign comes with its own set of objectives and KPIs. A marketing dashboard allows businesses to track these metrics, providing a clear indication of progress towards goals. Whether it's website traffic, conversion rates, or return on investment (ROI), a dashboard helps marketers stay laser-focused on what matters most.
- Enhancing accountability and transparency: With multiple teams and stakeholders involved in marketing activities, accountability and transparency are essential. A marketing dashboard provides a centralized platform for sharing insights, aligning teams, and fostering collaboration. By making performance metrics accessible to all stakeholders, businesses can ensure everyone is on the same page and working towards common goals.
- Driving data-driven decision-making: A marketing dashboard empowers businesses to make informed decisions backed by data and insights. Whether it's allocating budget resources, refining targeting strategies, or optimizing campaign tactics, data-driven decision-making is the cornerstone of success.
In essence, the purpose of a marketing dashboard is to provide businesses with the insights, agility, and clarity they need to navigate the complex landscape of digital marketing effectively. By centralizing data, offering real-time insights, measuring KPIs, enhancing accountability, and driving data-driven decision-making, a well-designed dashboard becomes an indispensable tool for marketers striving to achieve their goals.
What makes a good marketing dashboard?
Understanding the key elements that make up an effective marketing dashboard isn’t that difficult but it can really help you use data to make decisions that are driven by data. Let's delve into three core concepts that define a good marketing dashboard:
- Data integration: At the heart of every effective marketing dashboard lies seamless data integration. This process connects disparate tools and platforms, allowing data from various sources to converge into a single, unified dashboard. Known as application integration, this ensures that marketers have access to a comprehensive view of their business activities. By leveraging APIs (application program interfaces), data integration automates information sharing, streamlines data transfer processes, and enhances visibility across the organization.
- Data analytics: Data analysis forms the backbone of any marketing dashboard, empowering marketers to extract actionable insights from raw data. With the advent of automated, machine-led data analytics, the analysis process becomes faster, more efficient, and more insightful. By employing complex algorithms, marketing dashboards automate data analysis, significantly reducing the time required to glean insights and optimize business decisions. This data-driven approach enables marketers to make informed decisions based on real-time data, driving efficiency and efficacy in marketing strategies.
- Data visualization: Data visualization transforms complex datasets into visually compelling representations, making it easier for marketers to interpret and understand critical insights. By leveraging visual elements such as graphs, charts, and diagrams, data visualization enhances the human brain's ability to process and comprehend information rapidly. There are various classifications of data visualization, including time change, comparison, classification, distribution, and correlation. Each type serves a unique purpose, enabling marketers to communicate insights effectively and facilitate data-driven decision-making.
What is included in a marketing dashboard?
Any effective marketing dashboard will be made of KPIs that are meaningful to marketing campaigns and performance. These can be at a business, team, or even individual level, depending on the type of marketing dashboard you choose (we’ll get to that down below). Usually, these will include KPIs from categories like lead generation, website performance, social media, and email marketing.
Choosing the right KPIs for your marketing dashboard is essential as that is what will give you visibility of your progress towards your overall goals. Remember, tying KPIs to your larger goals is crucial, otherwise you’re just tracking vanity metrics.
Types of KPIs to Include
Understanding your business's performance requires a diverse range of KPIs. Quantitative indicators, like customer churn rates and lead conversions, provide clear, data-driven insights. Adding qualitative indicators, such as customer satisfaction surveys, captures subjective opinions, enriching your understanding. By combining both types of KPIs, you gain a complete view of your performance, guiding better decisions.
Distinguishing between leading and lagging indicators enhances your predictive capabilities and retrospective analysis. Leading indicators anticipate future performance based on current trends, helping you make proactive decisions. Lagging indicators provide valuable insights into past performance, aiding long-term planning. Incorporating a mix of KPI types ensures your marketing dashboard offers a comprehensive understanding of your business's performance, empowering informed decisions for sustainable growth.

Examples of important KPIs to include in your marketing dashboard
While the exact KPIs to include will vary depending on your role and business, there are a few that can provide insight into your marketing performance as a whole, so can be important for all teams to be aware of:
Customer Acquisition Costs (CAC): A crucial metric that reveals how much it costs to convert a customer. Monitoring CAC helps you identify inefficiencies and optimize your marketing spend to maximize ROI.
Revenue Generated: Track the revenue directly attributed to your marketing efforts, providing a real-time gauge of campaign performance and overall effectiveness.
Revenue Growth: Measure the increase or decrease in revenue over time to assess the impact of new strategies and tactics on your bottom line.
Customer Retention Rate: Understand how well you're retaining customers and identify any potential issues that may impact long-term business growth.
Website Traffic: Visualize the number of visitors to your website in real-time and on a monthly basis, allowing you to seize opportunities for conversion and address any traffic fluctuations promptly.
Traffic to Marketing Qualified Lead (MQL) Rate: Evaluate the effectiveness of your content marketing strategy by tracking the number of MQLs generated from gated content and assessing the quality of website traffic.
Net Promoter Score (NPS): NPS measures customer loyalty and satisfaction by asking how likely customers are to recommend your product or service to others. Including NPS on a marketing dashboard provides valuable insights into customer sentiment and helps gauge overall brand perception and loyalty
Examples of marketing dashboards
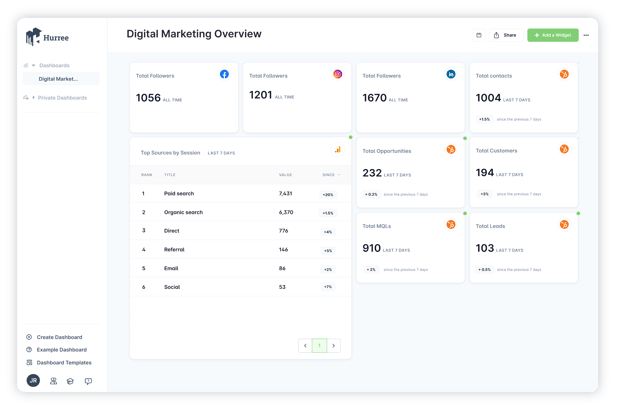
Digital Marketing Overview
Provides a comprehensive snapshot of digital marketing performance, including website traffic, conversion rates, email campaign effectiveness, and overall ROI. It helps marketers track the success of their digital marketing efforts across various channels and identify areas for optimization to drive better results.
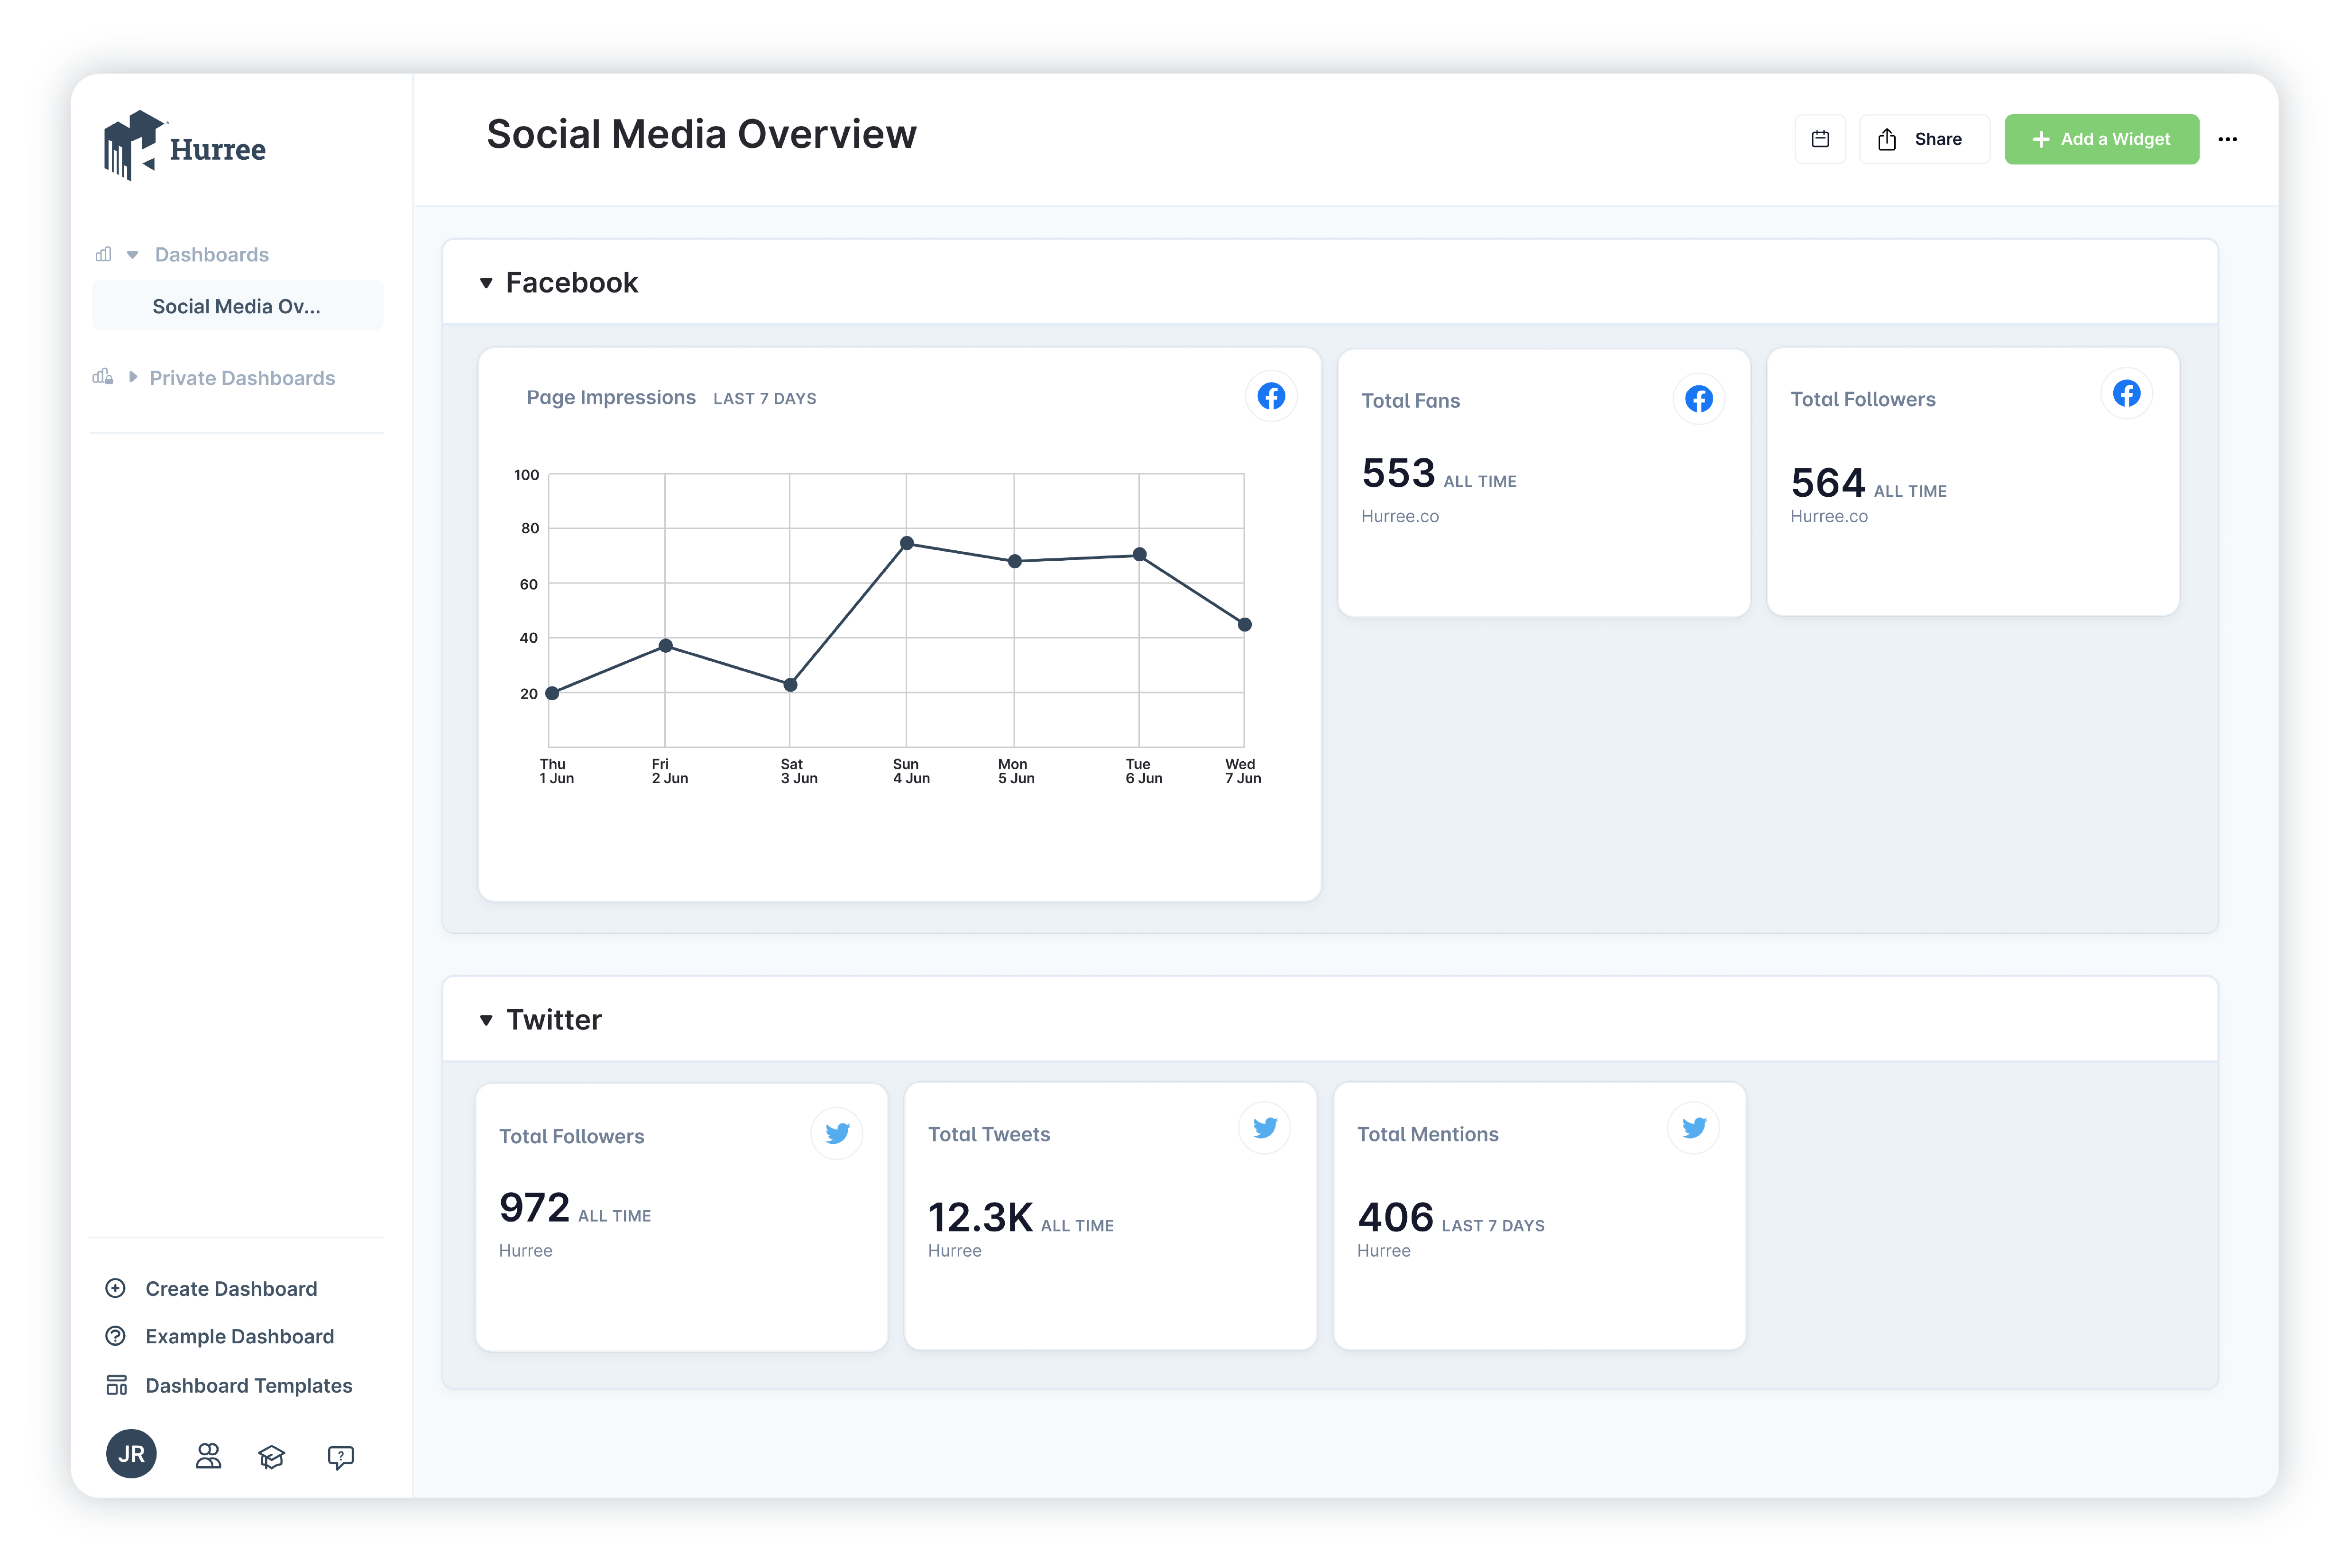
Social Media Overview
Offers insights into social media performance across multiple platforms, showcasing key metrics such as engagement rates, follower growth, post reach, and top-performing content. It enables marketers to monitor social media effectiveness, identify trends, and tailor content strategies to maximize audience engagement and brand visibility.
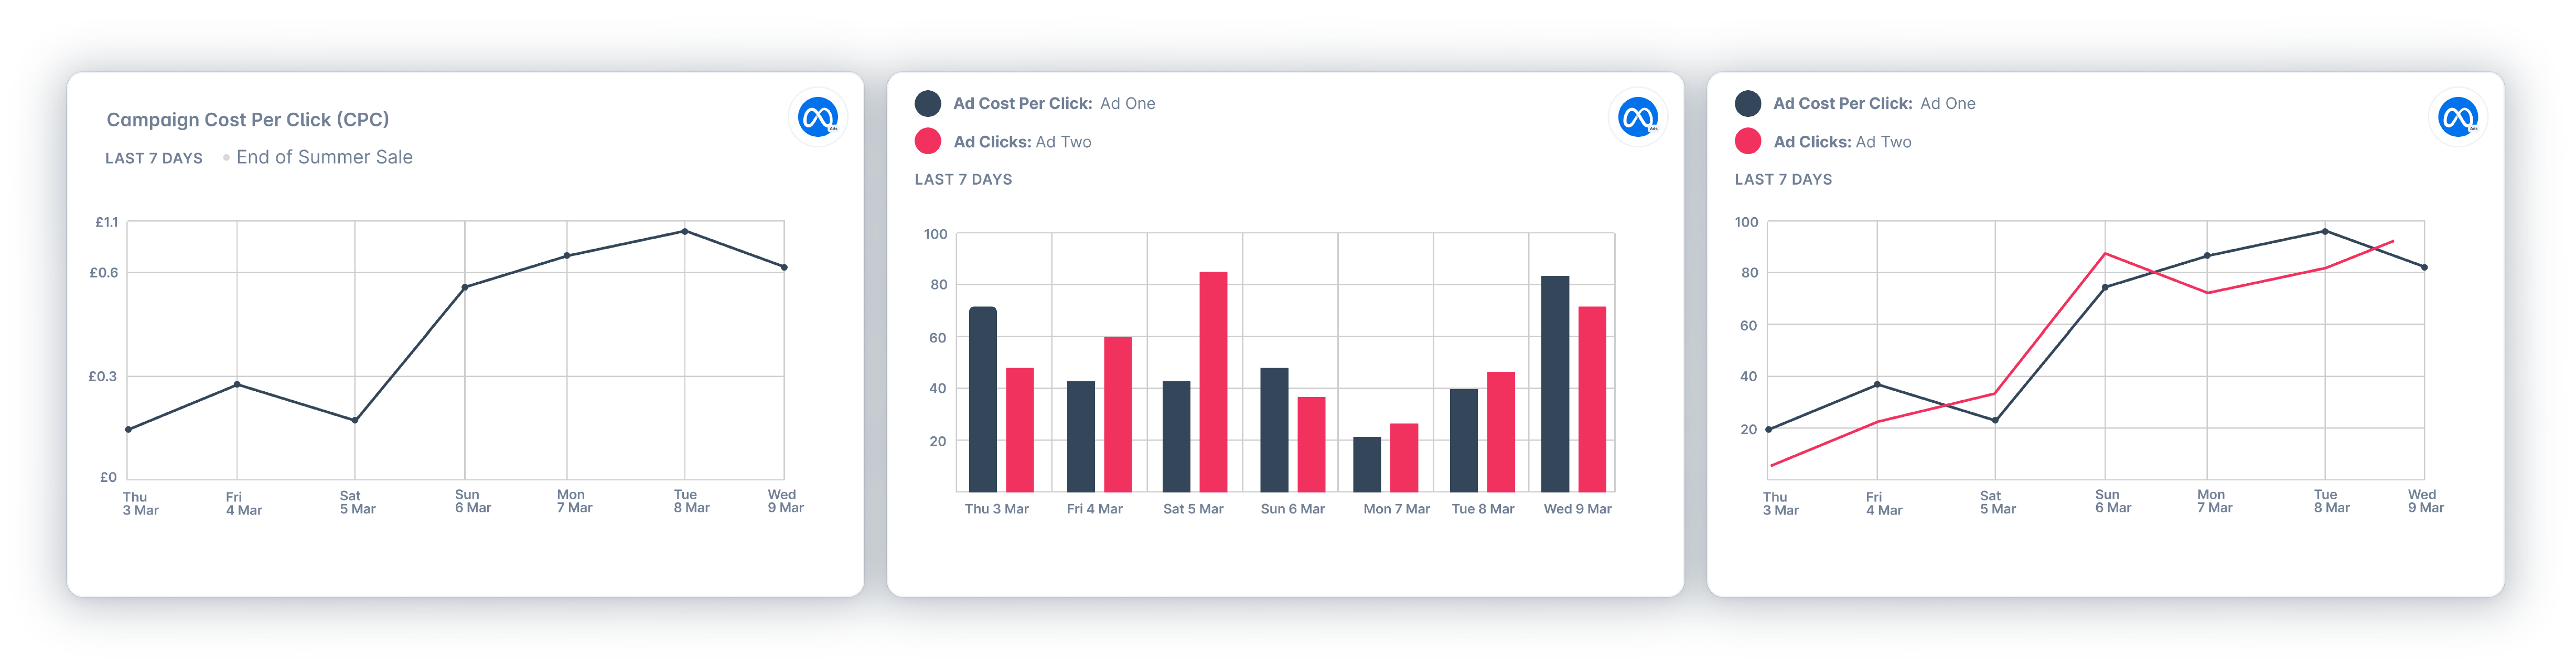
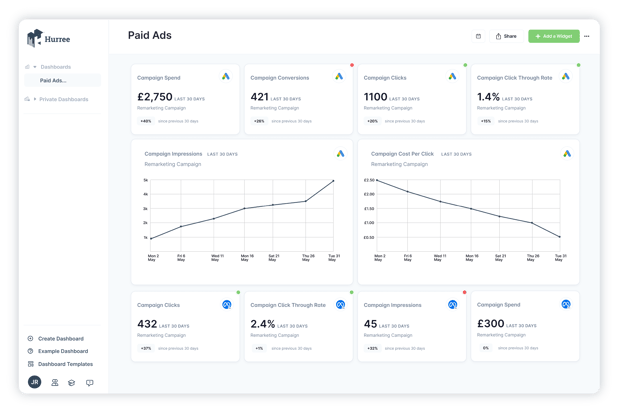
Paid Ads
Provides detailed analytics on the performance of paid advertising campaigns, including click-through rates, conversion rates, cost per acquisition, and return on ad spend (ROAS). It helps marketers track the effectiveness of their ad spend, optimize campaign targeting and messaging, and allocate budgets more efficiently to drive better ROI.
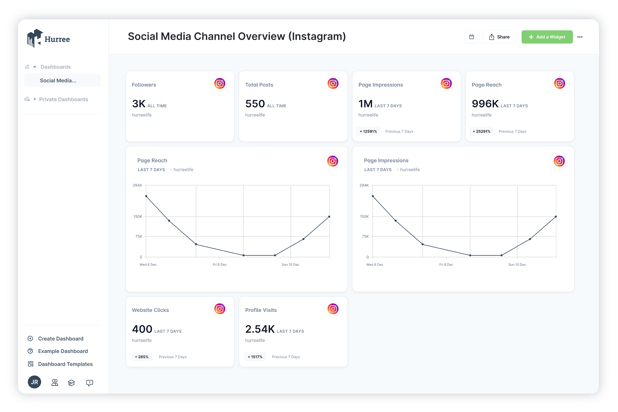
Social Media Channel Overview (Instagram)
Focuses specifically on Instagram performance metrics, such as follower demographics, engagement rates, post impressions, and hashtag performance. It allows marketers to assess the effectiveness of their Instagram marketing efforts, identify popular content trends, and refine their Instagram strategy to better engage their target audience.
Summing Up
Dashboards, especially in marketing, allow you to level up your performance. They are a simple and effective way to track progress, centralize data, and ensure your entire team (or business) is on the same page.
If you’re looking for a tool to get started with a marketing dashboard, check out Hurree. We offer a 7-day free trial, as well a free forever option, so you can track your marketing performance with powerful, effective dashboards.


Share this

What is a Key Performance Indicator (KPI)?

6 Benefits of KPI Reporting