The ability to effectively visualize data is a valuable skill that can transform the way businesses understand and leverage information. Whether you're a marketing professional sharing campaign results, a CEO making critical decisions, or a business leader striving for better insights, understanding what data visualization is, why it’s important and the different types of visualizations available is essential to mastering it and getting the most from your data.
What is data visualization?
Data visualization is the process of translating raw data into visual forms such as charts, graphs, and dashboards that provide comprehensible, meaningful insights. Rather than sifting through rows and columns of data in spreadsheets, data visualization allows you to see trends, patterns, and relationships at a glance. It transforms data into a visual story, making it easier for individuals and businesses to make informed decisions, identify opportunities, and understand the significance of their data. In essence, data visualization is the bridge between data and actionable knowledge, enabling us to extract valuable insights from the sometimes overwhelming sea of information at our disposal.
Source: Atlassian
Why is data visualization important?
- Uncovering insights: Data visualization is crucial because it helps extract valuable insights from complex data. It transforms raw numbers and statistics into visual representations like charts and graphs, making it easier to identify trends, patterns, and relationships that might not be apparent in raw data. Instead of overloading you with information, data visualization takes the most valuable data and displays it in a way that makes more sense.This, in turn, paves the way for informed decision-making.
- Effective communication: Visuals are a universal language, transcending linguistic barriers. They allow us to communicate data and insights effectively to a diverse audience. Whether you're reporting to stakeholders, clients, or team members, data visualizations can convey complex information in a clear and understandable manner. Visuals are inherently more engaging than just text or numbers alone. Well-designed, aesthetically pleasing charts and graphics draw the eye, encouraging your audience to explore the information further. Coupled with the fact that visuals are more memorable than text alone, your audience is more likely to retain and recall the information presented through data visualization, making your message more effective.

Source: Pepper Blog
- Quick decision-making: In most workplaces, speed matters. Visual data is processed by the brain much faster than text or tables. With data visualizations, you can quickly grasp key information without having to sift through endless data to uncover insights, facilitating rapid decision-making, particularly beneficial in time-sensitive situations.

Source: Digiteum
- Discovering relationships: Data visualization makes it easier to identify relationships and correlations within your data. Whether you're analyzing market trends, customer behavior, or financial metrics, visualizations help uncover hidden connections, which is essential for informed decision-making and strategy development.
Different types of visualizations
There are a wide variety of data visualizations you can choose from, each designed to summarize large amounts of data in different ways. The best option will depend on the type and quantity of data you are using, what you are trying to show, who it is designed for and the data visualization tools you have available. Here are a few of the most common types:
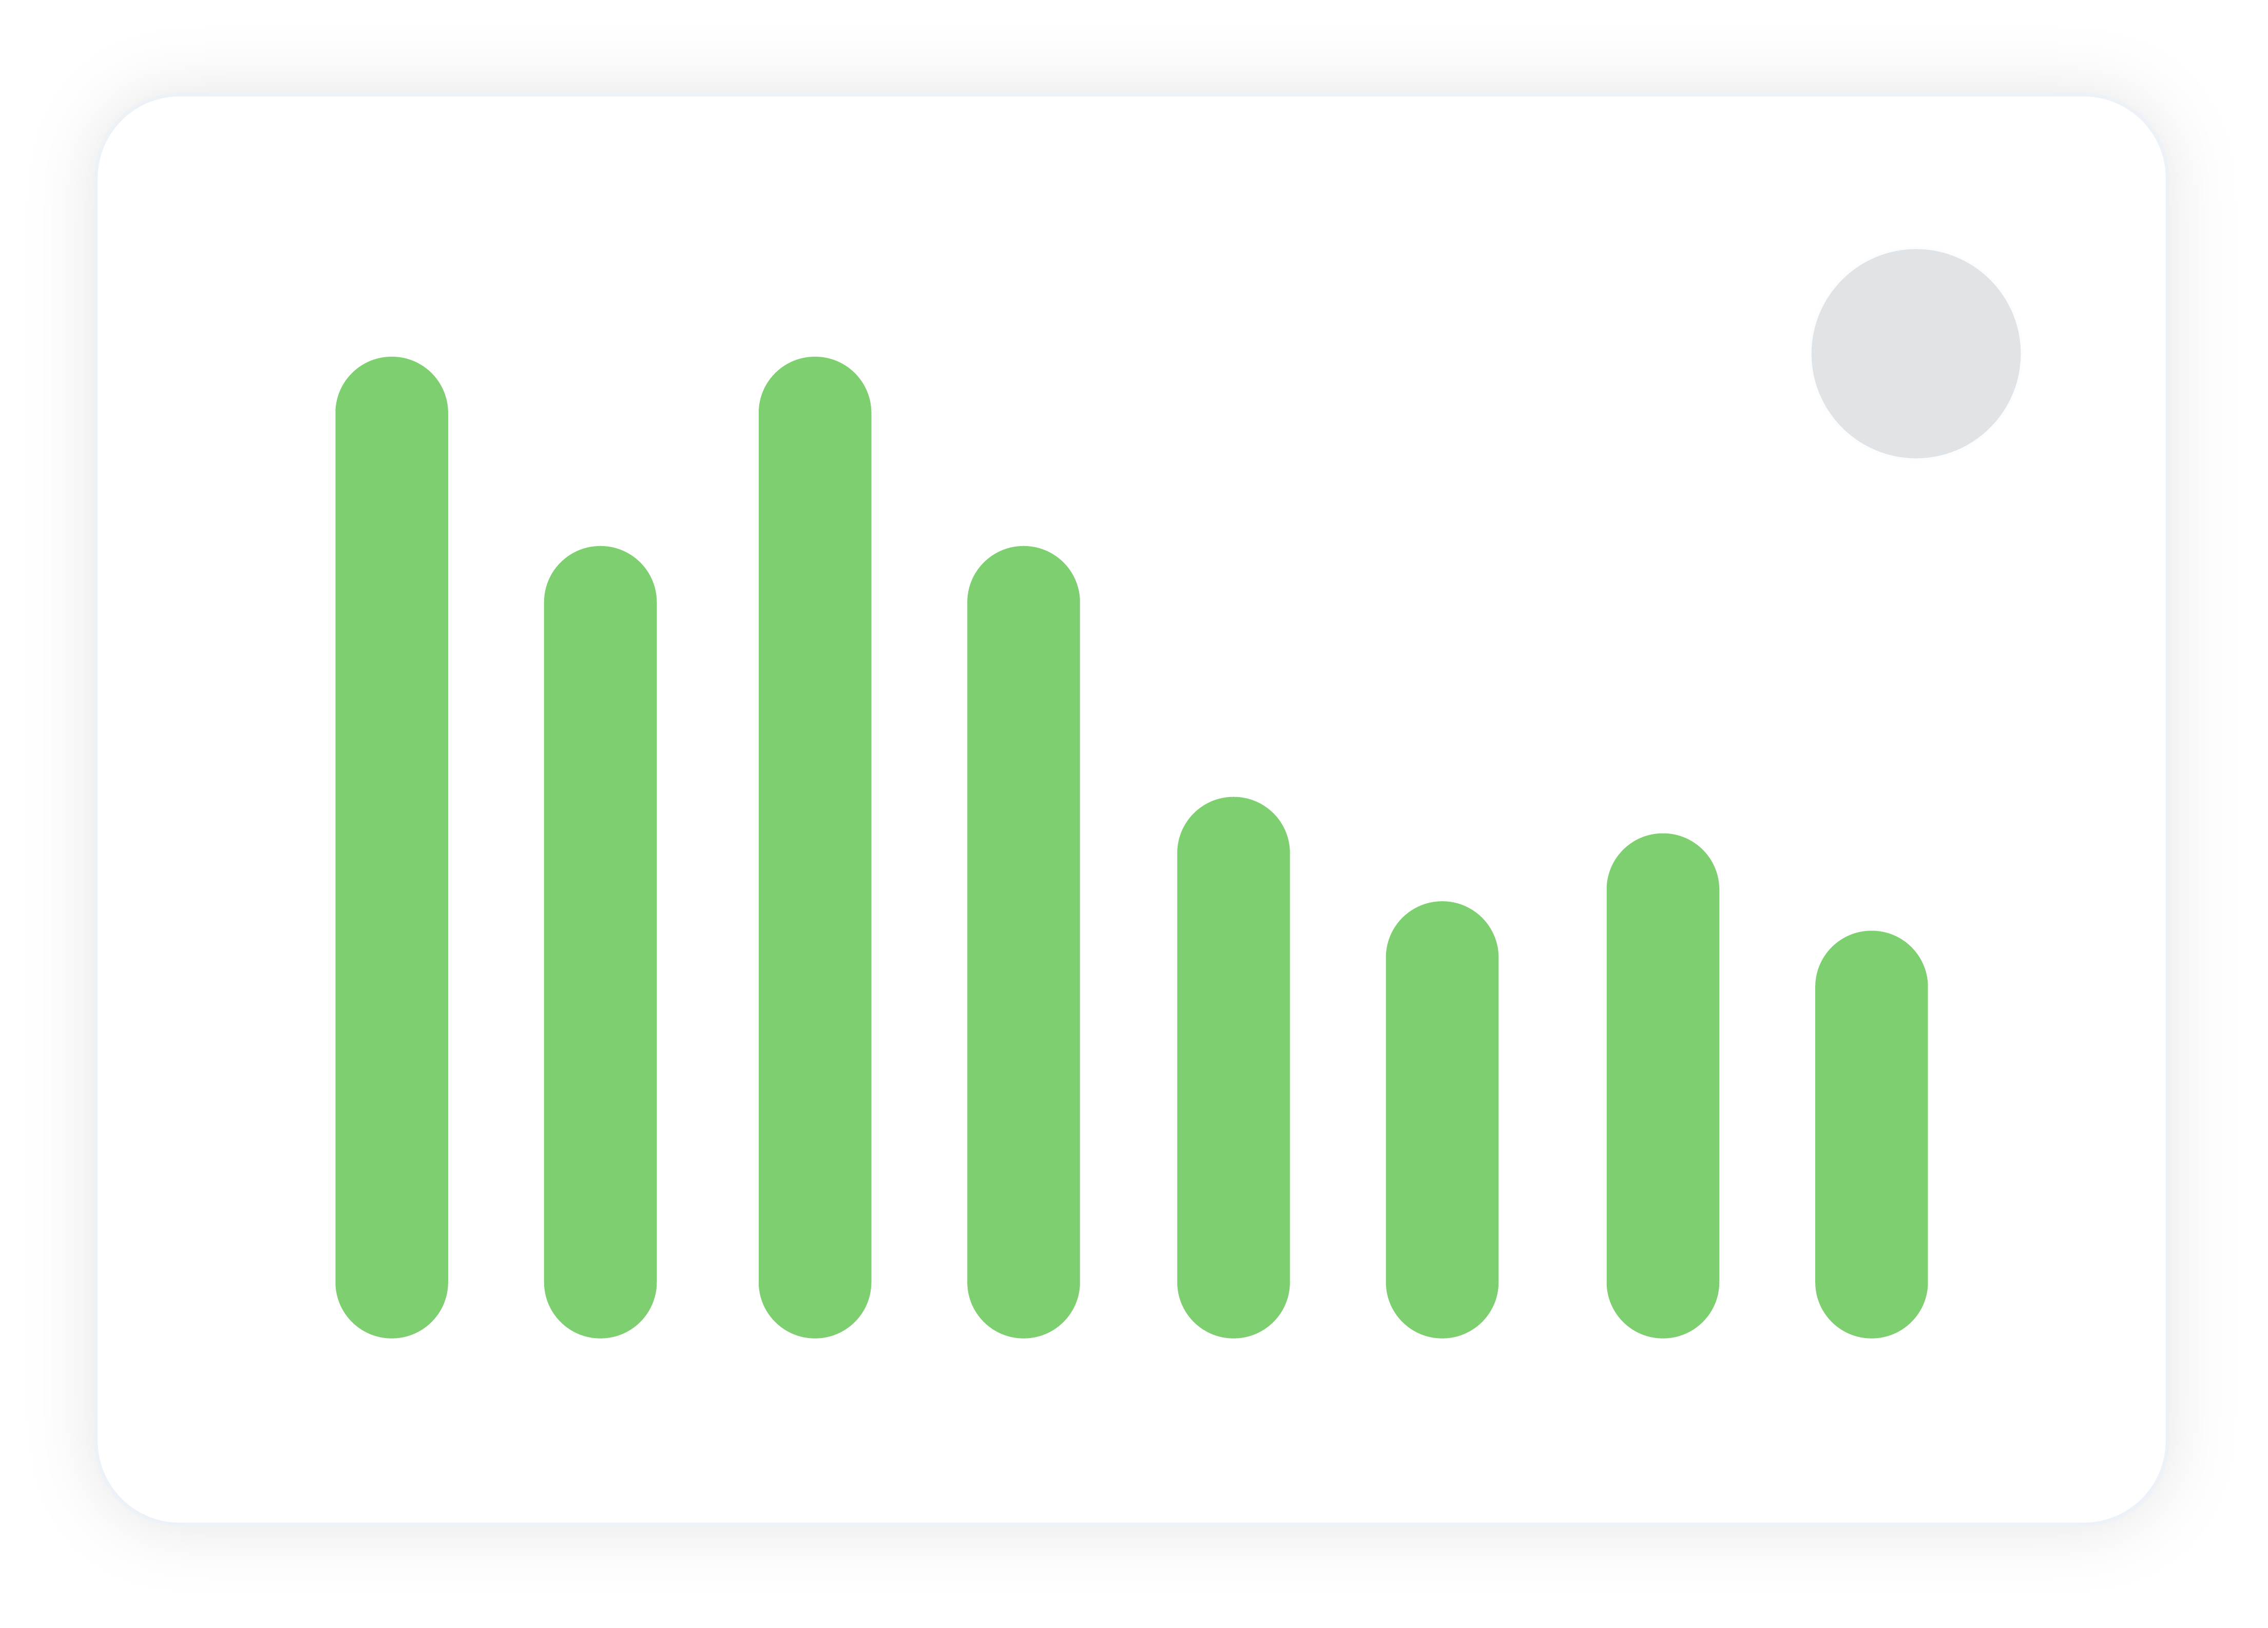
Bar chart
These are probably the most commonly used chart types for data visualization and reporting and are an ideal solution for displaying several values that can be split into distinct groups or categories. The length of each bar indicates the value and are great for perfectly designed for making comparisons across different categories. For example, you can use a bar chart to compare sales figures for different products or the performance of different marketing campaigns. The specific data you choose to display on a bar chart should align with your objectives and the story you want to convey.
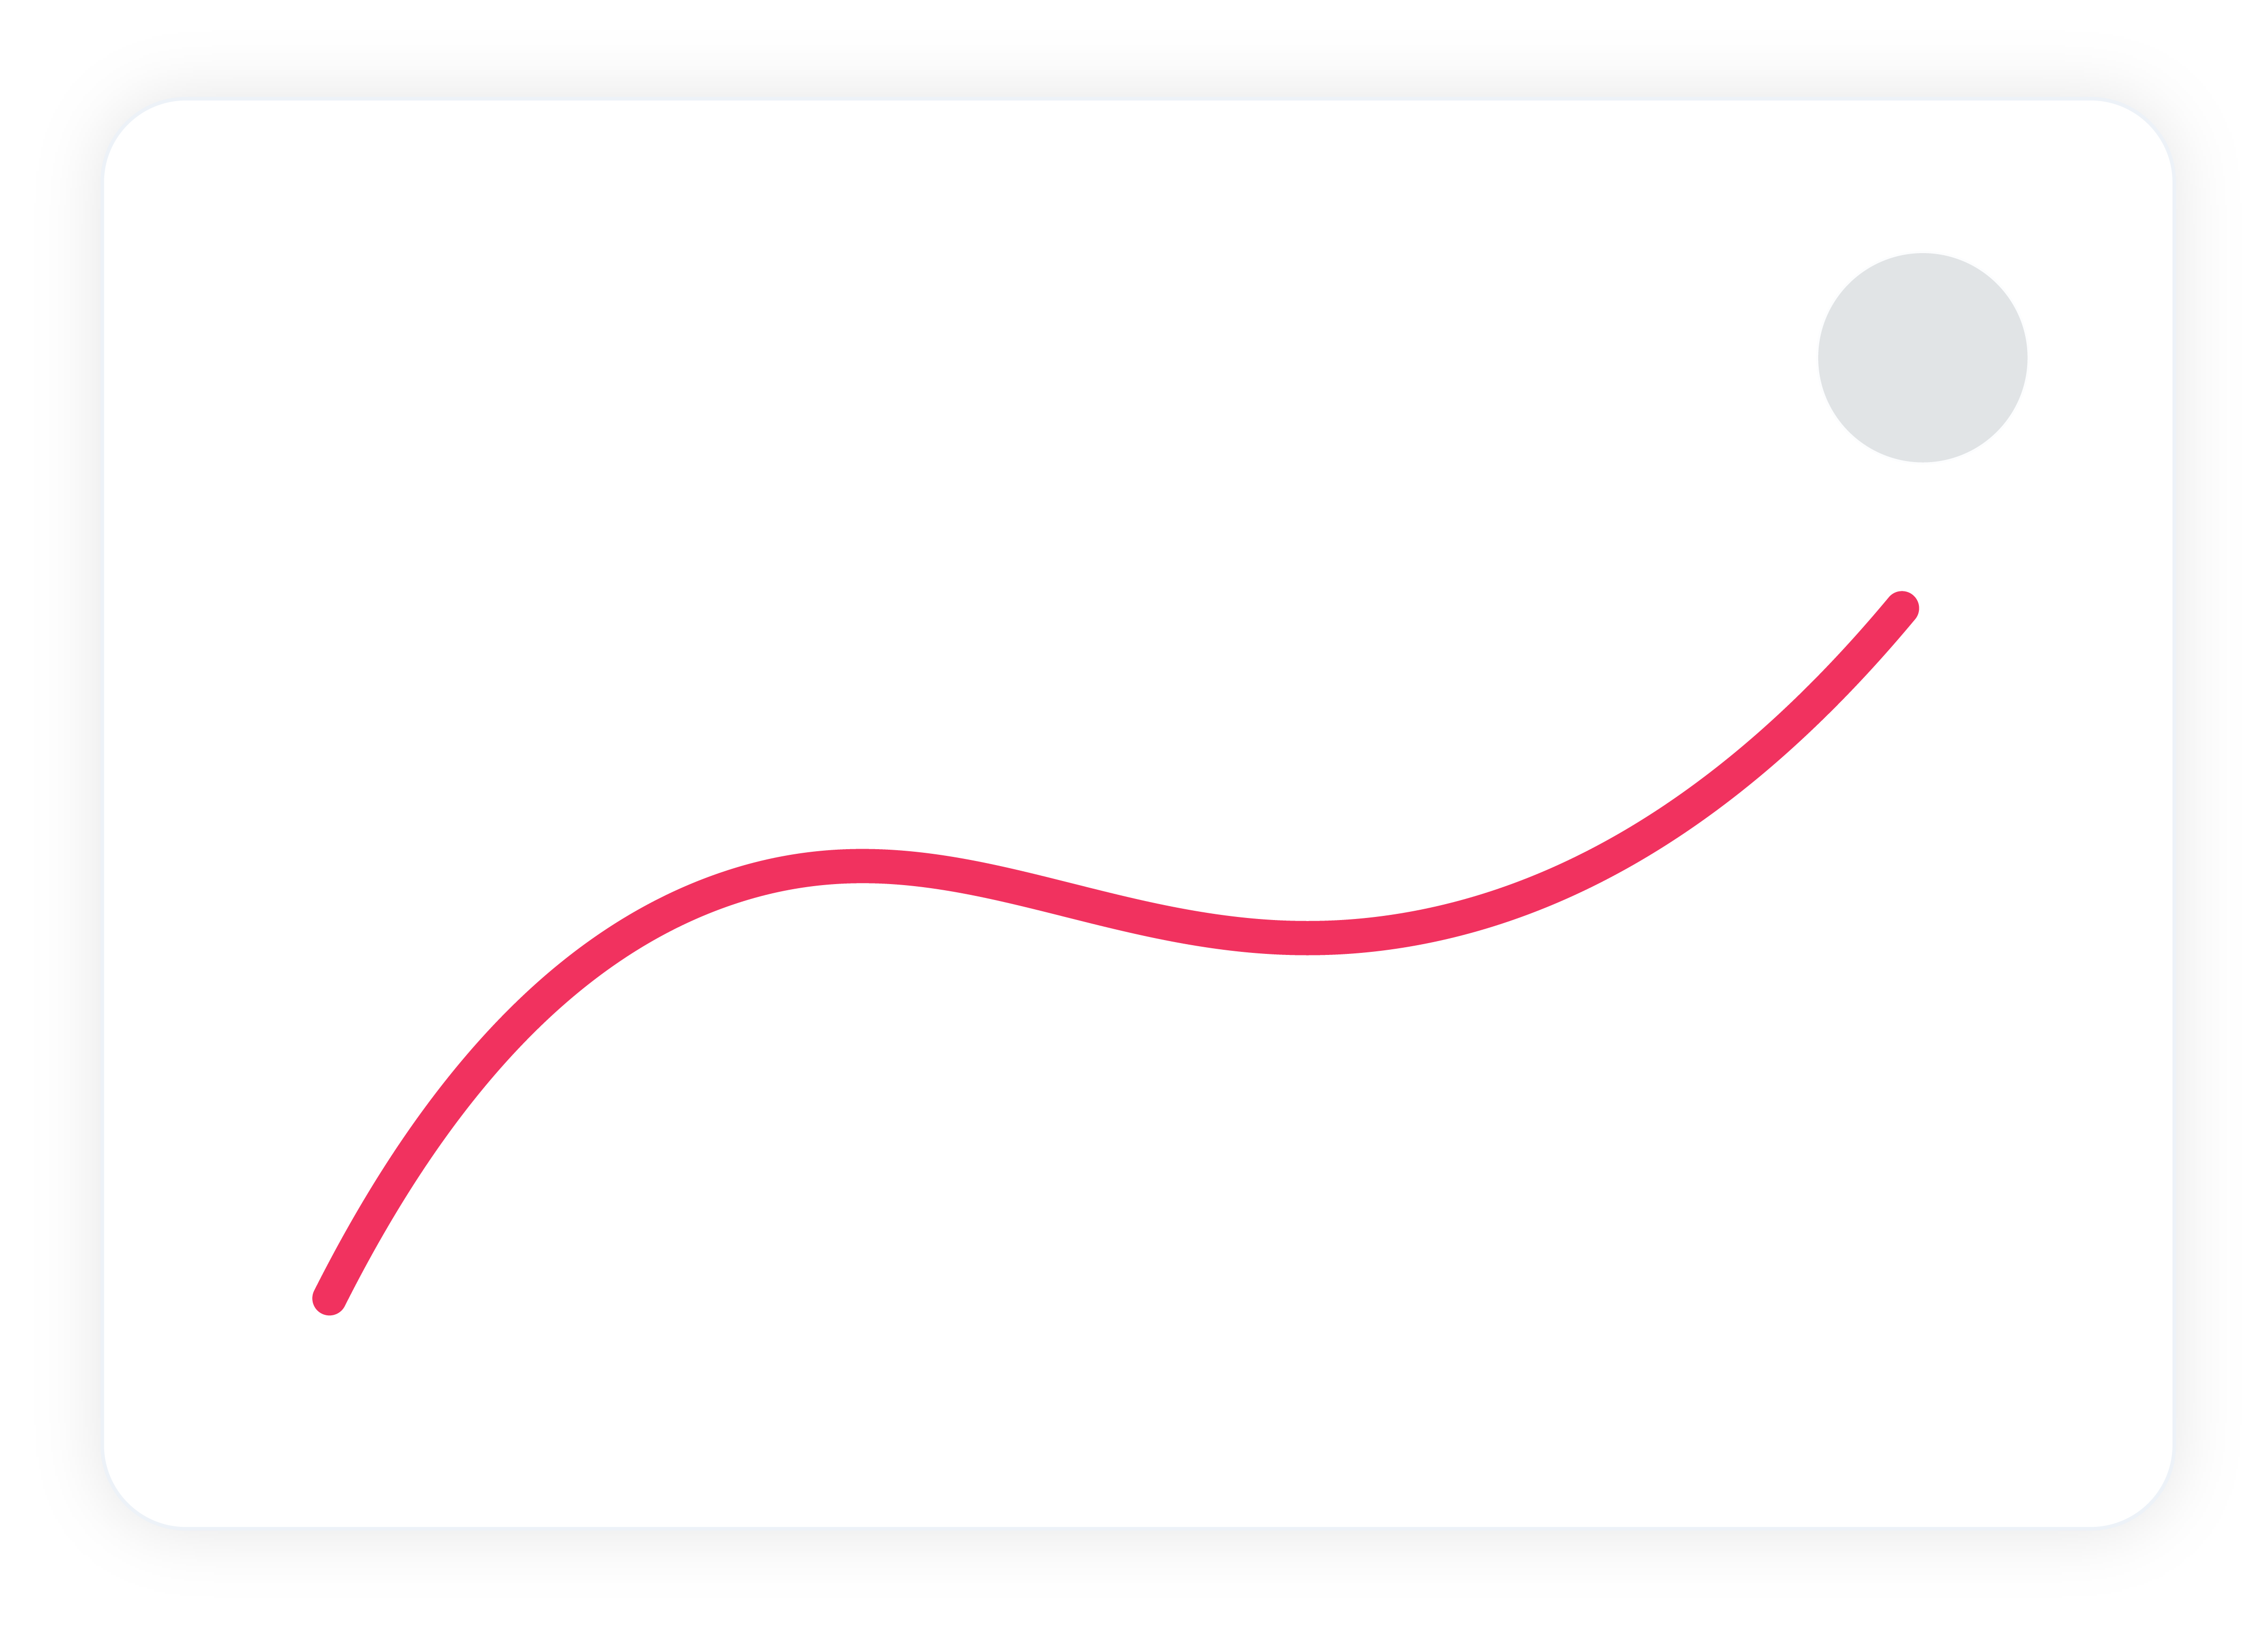
Line graph
These are most effective for showing data that involves changes or trends over a continuous range, typically time. It illustrates trends in a way that is easy to interpret, making it a popular method of displaying data. You might use a line graph to analyze the performance of your website in terms of daily or monthly traffic over the year. A line graph will help you detect trends and patterns in how your website's visitors change over time and allow you to correlate this to specific marketing campaigns or seasonality.
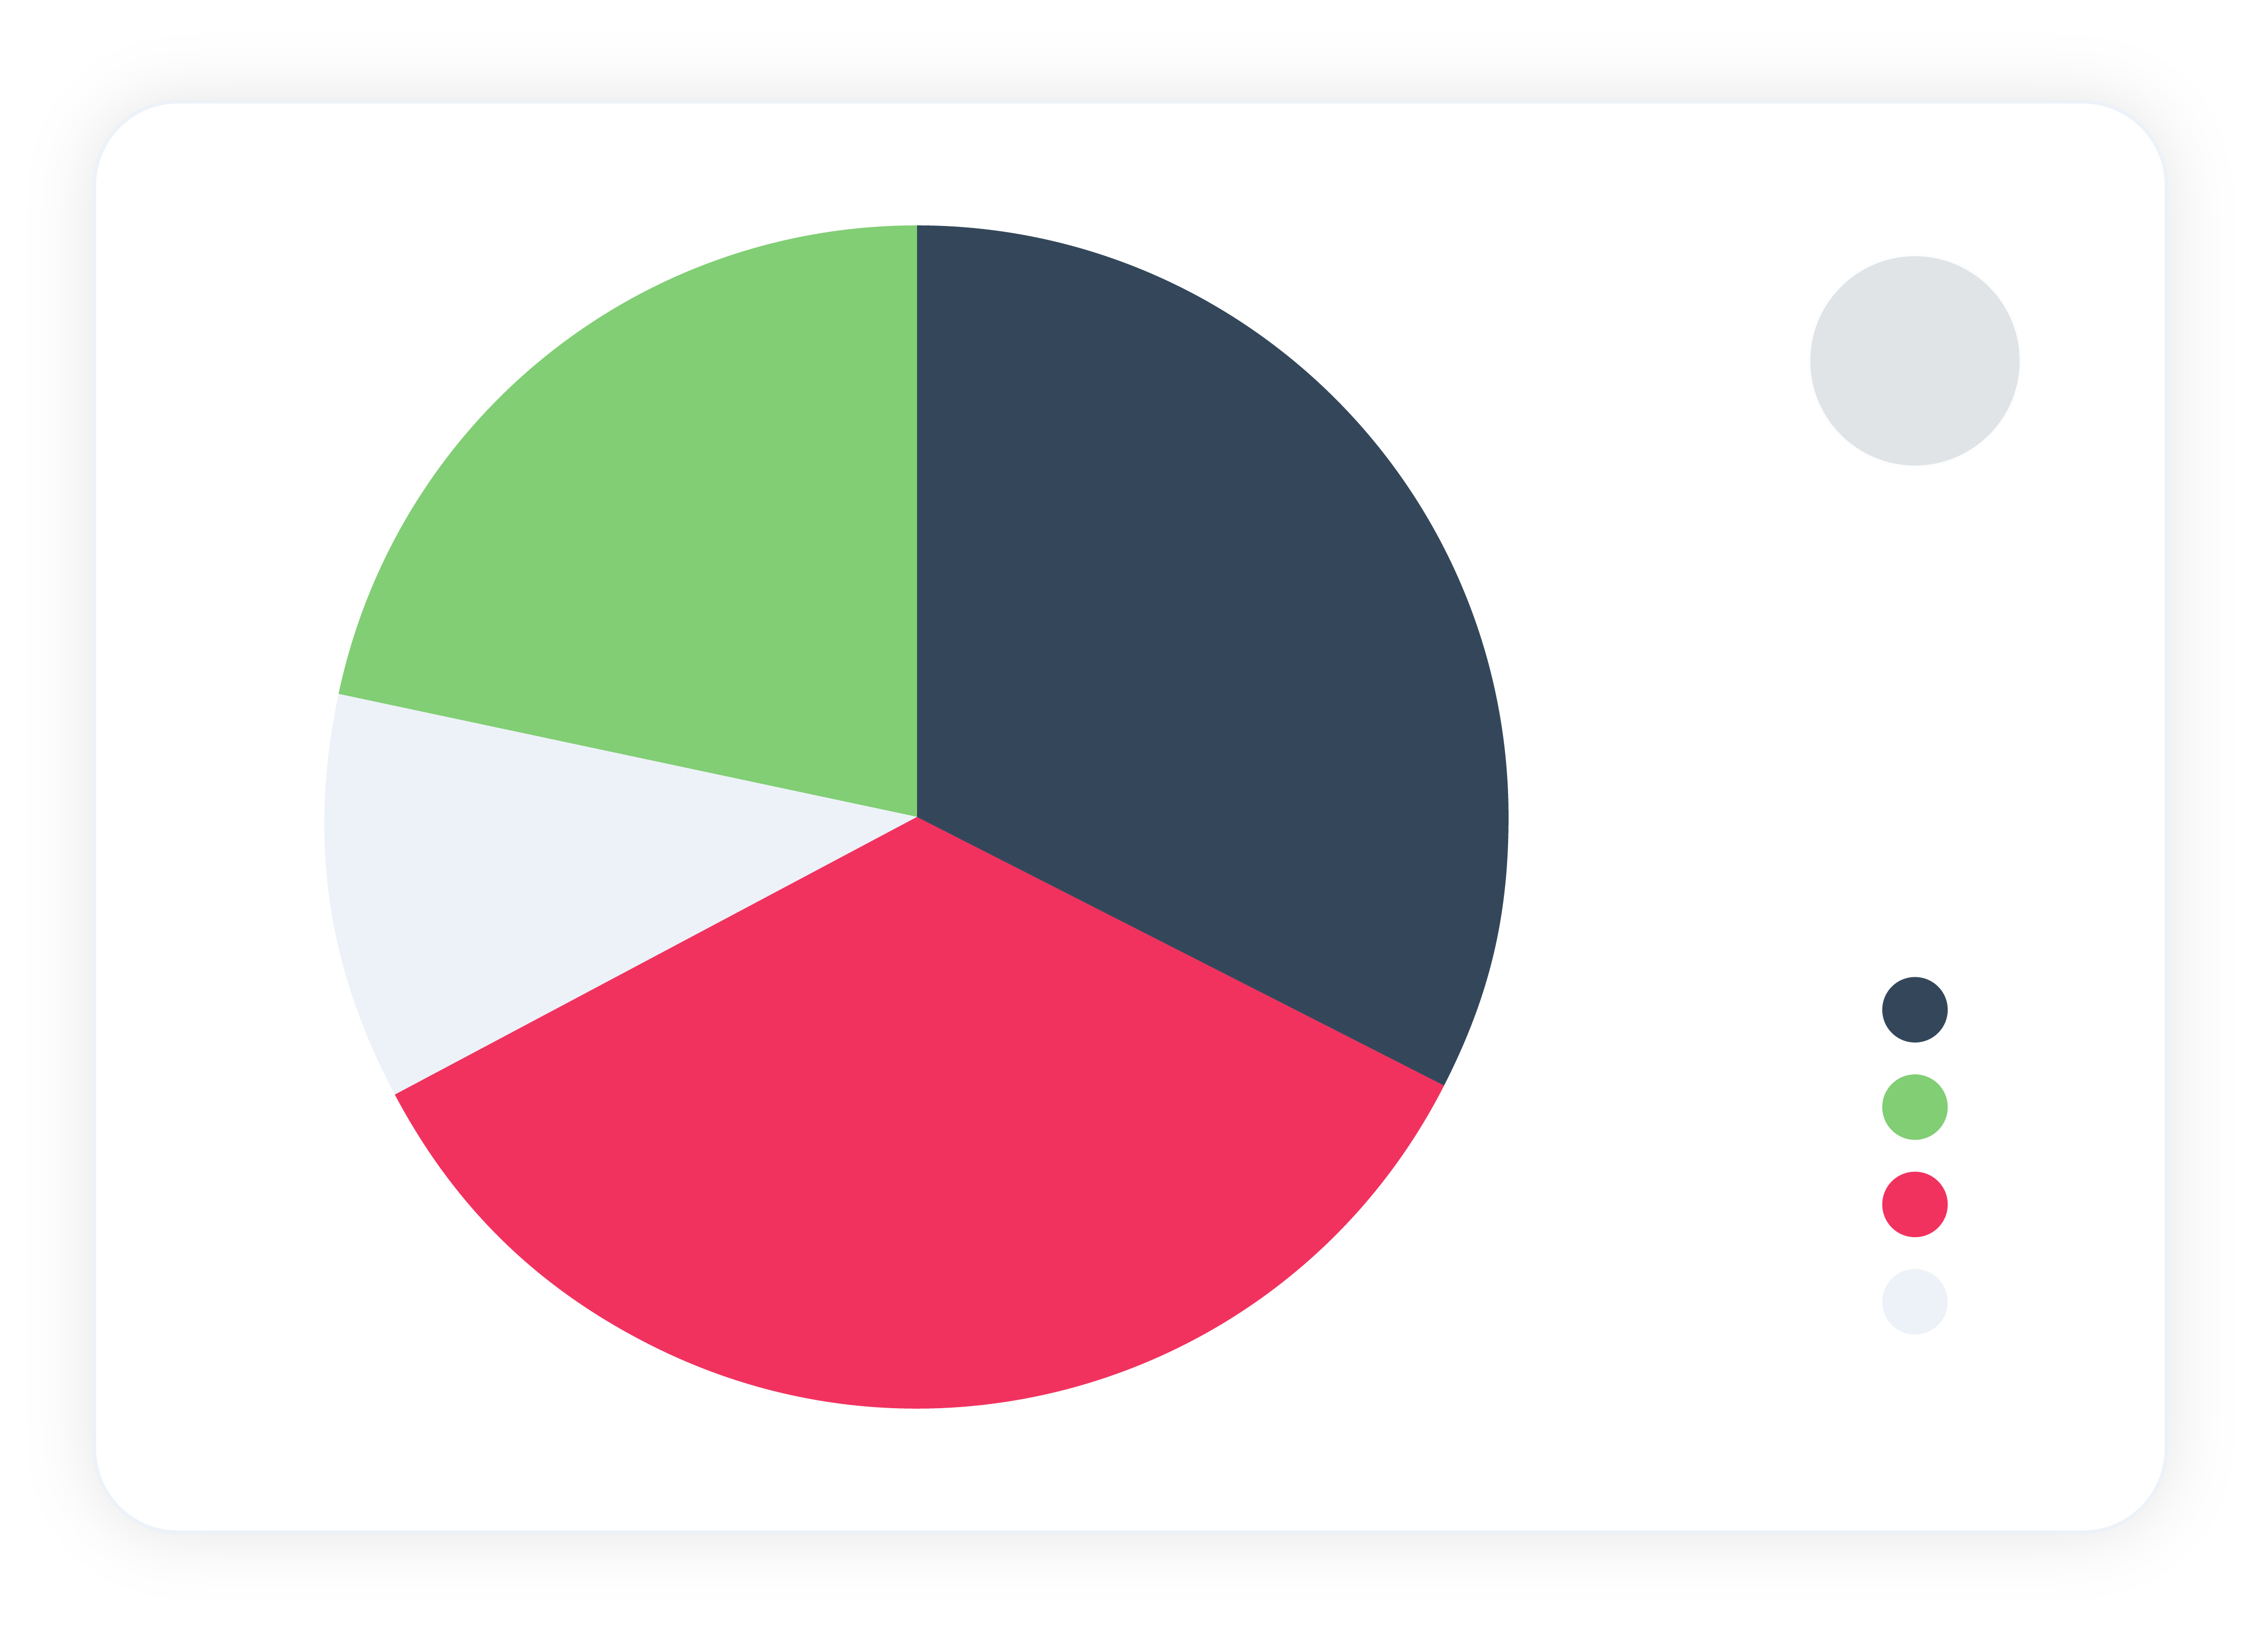
Pie chart
The circular graph shows data size through each of its pie-shaped slices and is an ideal solution for displaying how individual parts contribute to the total. A pie chart would be the perfect solution to represent the allocation of marketing budgets across various marketing channels for the year. It will clearly show how much has been spent on activities such as social media, email marketing, influencer marketing and PPC. Pie charts are typically used best for data with a relatively small number of categories (no more than six or seven), otherwise, your pie chart can become overwhelming with too many slices to try and decipher. It’s also best to use different colours for each slice to make interpretation easier.
Funnel chart
These are ideal for displaying data that follows a sequential process, with stages that progressively narrow down or filter data. They provide a clear visual representation of how data flows through a sequence, making it easier to identify bottlenecks, areas for improvement, or stages with the highest or lowest conversion rates. Funnel charts are particularly useful for data-driven decision-making and process optimization. For example, a funnel chart is an ideal solution for highlighting user interactions on a website, such as conversion rate from visitors to registered users to paying customers. Funnel charts help identify where users drop off in the conversion process and allow you to make adjustments to correct the drop-offs.
Area chart
An area chart is essentially a line chart but the space between the x-axis and line is filled, and is ideal when you want to emphasize the magnitude of change over time, compare multiple data series, or show the cumulative effect of multiple variables. An example of when you might use an area chart is for monthly sales data for different product categories. The area chart will allow you to visualize how each category's sales contribute to the overall revenue and identify trends over time. Since you have monthly data, you can plot sales data over time, with each month's data stacked on top of the previous month, creating a visual representation of how the sales revenue for each category evolves over time. If certain product categories dominate in terms of revenue generation, the area chart can make this clear. The shaded area for the dominant categories will be larger, emphasizing their significance.
Scatter Plots
Scatter plots are used to visualize the relationship between two continuous variables. They are valuable for identifying correlations, clusters, outliers, and trends in data points. For example, a scatter plot is a valuable way to visualize and understand the relationship between advertising spending and customer conversions. You can plot the number of ad impressions on the x-axis (horizontal) and the conversion rates on the y-axis (vertical). This will allow you clearly see if there's any correlation between the number of impressions an ad receives and its conversion rate. This can help you identify which ad creatives are most effective at converting viewers into customers.
Top tips for data visualization
1. Know your audience
Understanding your audience is the first step in creating compelling data visualizations. Consider their familiarity with the subject matter and their specific needs. Marketing professionals may require visuals that highlight specific marketing campaign performance, while CEOs might need high-level overview dashboards showing financial metrics for strategic decisions. Tailoring your visualizations to your audience ensures they are meaningful and impactful.
2. Choose the right visualization typeSelecting the appropriate visualization type is crucial. Bar charts, line graphs, pie charts, and scatter plots are just a few of the options available. Take time to assess your data and choose a format that effectively conveys the intended message. For instance, use a line graph for showing trends over time and a bar chart for comparing categories. It’s important to use a variety of visualizations, however, it’s just as important not to overdo it. Remember, it’s not about the number of visuals, it’s about choosing the right type, and ensuring they’re actually adding value. If every single visual on your report or dashboard is a graph, it can quickly become loud and hard to recognise the key pieces of information you are trying to convey.
3. Simplify and declutterLess is often more when it comes to data visualization. Avoid cluttering your visualizations with unnecessary elements. Use clear labels, concise titles, and a minimal colour palette to enhance clarity. Your goal is to guide your audience's attention to the most critical insights without overwhelming them.
4. Tell a story with dataData visualization is a powerful storytelling tool. Craft a narrative around your data to make it more engaging and relatable. Explain the context, highlight key findings, and guide your audience through the story your data is telling. This approach transforms data into actionable insights.
5. Embrace interactivityInteractive data visualizations offer an opportunity for deeper exploration. Consider tools and platforms that allow users to interact with your visuals. This can include hover-over tooltips, zoom features, or filters. Interactivity empowers your audience to delve into the data and uncover insights relevant to their specific interests.
6. Consistency is keyMaintain consistency in your visualizations to enhance comprehension. Use consistent colour schemes, fonts, and labelling conventions across different charts and dashboards. This ensures that your audience can easily compare and interpret data points.
7. Test and iterateDon't be afraid to experiment and refine your visualizations. Test different chart types, colour combinations, and layouts to determine what works best for your audience. Continuous iteration leads to more effective and insightful visuals.
8. Utilize data visualization toolsWithout a design background, achieving successful data visualization on your own can be challenging. That's why it's beneficial to use a tool that can simplify the creation process. Look for platforms that offer customization options, a variety of chart types, the ability to easily integrate with all of your data sources and are easily shareable with stakeholders. Tools like Hurree are the ideal solution for this.
Mastering the art of data visualization is not merely a skill; it's a strategic imperative in today's data-driven world. The ability to distill complex data into clear, actionable insights empowers professionals across all sectors to make informed decisions, communicate effectively, and drive success. With the right data visualization tools like Hurree, data visualization becomes a smooth and highly efficient process. Hurree offers a versatile platform equipped with customization options, a variety of chart types, and seamless integration with your data sources. Whether you're a marketing professional, a CEO, or a business leader, Hurree empowers you to transform your data into impactful visual stories. Start visualizing data with confidence and clarity, and watch your insights soar to new heights. Get started with your free trial today.

Share this

9 Powerful Data Visualization Examples

What is an Analytics Dashboard & What are the Benefits?