Powerful Marketing Metrics You Need for Data-Driven Success
Whether you work in marketing or not, it’s undeniable that metrics are a big part of your life.
We use metrics every day to measure so many things - most of the time, we don’t even notice. Filling up your car’s tank with fuel and working out how much the price has increased since your last tank, for example. Or when you read the grades on your kid’s report card or even the 5-star system that you use to determine whether a movie is worth watching. It’s become second nature to us to track and compare units to measure how good or bad something is, and how that changes over time.
Marketing metrics are taken a little more seriously, however. When I tell you we track everything, you may think I’m joking. Unfortunately not.
In the world of marketing, even the simplest of tasks like changing the text on a call-to-action (CTA) button can turn into an exercise in testing, tracking and comparing against benchmarks and marketing metrics. We’re marketing metrics-obsessed, and it’s only going to worsen as data-driven marketing reaches maturity, customer journeys become more complex and omnichannel experiences are adopted as the norm.
What are Marketing Metrics?
In a general sense, a metric is a system or standard of measurement. For professionals, marketing metrics are measurable values and processes used to measure the effectiveness of marketing activities and demonstrate results across marketing campaigns.
In the early days of marketing metrics, research methods borrowed from economics theory were used to measure the productivity and profitability of activities. From the late 1970s to the late 1980s, considerations around marketing metrics were expanded to measure non-monetary factors such as ‘unit-market share’ as it was considered that market share and product quality were strong predictors of profitability.
When the digital revolution took over marketing, new channels and tactics, such as social media or digital advertising, became commonplace. Marketers needed a way to keep track of these channels and gain insights from the data they produced. Attribution models were introduced to better understand the breakdown of success rates across multiple channels used within a marketing campaign.
Nowadays, more and more companies are adopting a customer-centric approach, moving toward integrated data and omnichannel analytics to gain 360-degree views of customers and deliver better experiences.
Why do we need to track marketing metrics?
Businesses need marketing metrics to:
- Achieve company goals
- Make data-driven decisions
- Prove marketing effectiveness
- Motivate team members and give credit
Powerful Marketing Metrics You Need for Data-Driven Success
Website Traffic
Your website exists to attract prospects, inform them about your products and services, and convert them into loyal customers. To optimise your website’s ability to serve these functions, you need to track your progress in the following areas, all of which can be handled in Google Analytics or your company CRM.
- Monthly traffic
Traffic, in website terms, means the number of web users who ‘visit’ your website. Each time a user visits your website, it is measured as a ‘session’.
It’s important to measure your traffic month-on-month as this is the number of opportunities your business has to convert into customers. This metric can help you set realistic conversion goals.
For example, if you set a goal of converting 500 customers each month but only receive 300 sessions per month, you are shooting for the impossible.
- Traffic sources
Where are the visitors to your website coming from? Several different sources may be driving traffic to your website; organic SEO (keywords, backlinks, etc.), direct, social media, email, paid search, and so on.
Understanding where most of your traffic comes from can help you delegate your time to channels that see the best results and know when to ditch using a tactic that’s not working.
- New vs returning IDs
The number of new vs returning visitors to your website can tell you a lot about how valuable users find your content.
Google defines new visitors as a user navigating your website for the first time via a specific device. For example, if you visit a website on your work laptop and then two days later visit on your mobile, you will be counted as two users.
Returning visitors are stored for two years by Google, meaning if a user visits more than once on the same device within two years, they will be counted as a returning visitor.
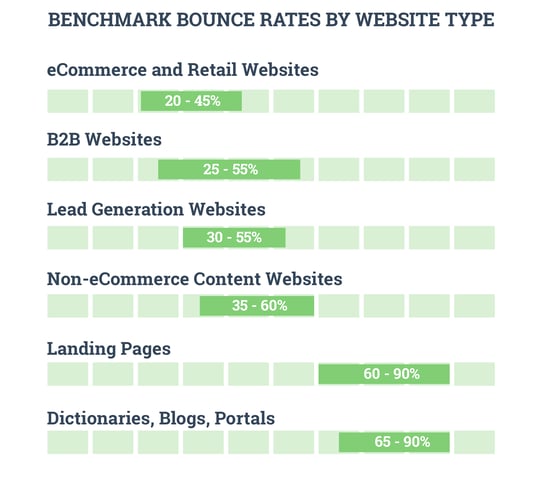
- Bounce rate
Do website visitors land on your website and bounce off again right away? Bounce rate is a metric that measures what percentage of visitors leave your site after viewing only one page.
Source: CXL
SEO
Search engine optimisation is the process of enhancing your website and content to improve the quality and quantity of traffic attracted to your company website. SEO is a continually evolving science that requires a lot of attention in today’s digital-first marketplaces.
- Domain Authority (DA)
A Domain Authority (DA) is a search engine ranking score developed by Moz; it is used to predict how likely a website’s content is to rank on SERPs (search engine results pages).
DA is a logarithmic number from 0 - 100, generated by considering numerous factors from linking root domains and total links into a single number. Whilst your website’s DA is not used by the likes of Google, it is, however, a highly respected metric among the wider SEO community and is used by multiple evaluators as a key indicator of website quality.
- Domain Rating (DR)
Another metric, this time by Ahrefs, is commonly used to estimate how authoritative a website is and its ability to rank in SERPs. Ahrefs also states that DR is a handy metric for marketers running link-building campaigns as it indicates “link-popularity” of a website. If DR is high, then a backlink from this website would be more valuable than a low DR site.
DR is rated from 0 - 100 and is generated by analysing your website’s backlink profile.
- Backlinks
Tracking the number of new backlinks your website has gained, either organically or via your link-building campaigns, is essential to get an idea of how your backlink profile is expanding over time.
It’s also important to monitor how many backlinks you lost during a period as a sharp drop in backlinks could be a heads-up to your content problems.
- No-follow links
No-follow links are hyperlinks with a rel=“nofollow” tag.
Links of this kind do not influence your website’s ability to rank in SERPs. Make sure to monitor what percentage of your backlinks are no-follow links and ensure that any link-partnerships or guest-posts you arrange are explicitly categorised as do-follow links.
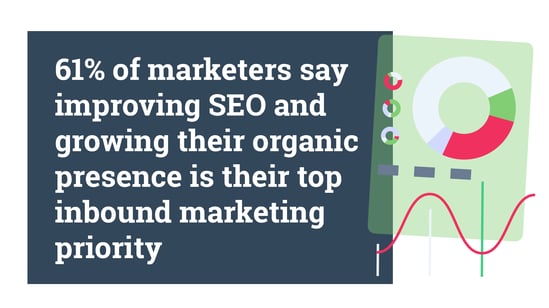
- Organic traffic
What percentage of your website traffic is generated by users searching specific keywords and finding your website as a result? According to BrightEdge, 53.3% of all website traffic comes from organic search.
This is a critical metric for marketing departments that focus on content marketing. Monitor your organic traffic month-on-month and record percentage increases or decreases.
If you do not see improvements in your organic traffic over time, you should reassess your content marketing efforts and keyword strategy.
- Keyword ranking performance
To target the correct audience for your website, you need to select specific keywords and create SEO-optimised content targeting those keywords to rank in SERPS and draw in users. Keyword ranking performance measures how successful your efforts are in this area.
To track keyword ranking performance, you need to determine how much organic traffic each of your chosen keywords generated and how many contacts were generated from each keyword.
You should also measure the click-through-rate of each keyword by dividing the number of impressions that keyword gains in SERPs by the number of users who click through to your keyword related content.
 Source: Impact Plus
A mainstay of any marketers’ tech stack is email marketing; there were 3.9 billion email users in 2019, and that number is expected to grow to 4.3 billion by 2023.
- Open rate
The open rate measures how many recipients opened your email; calculated in raw numbers or as a percentage.
According to Campaign Monitor, your email open rate should be between 15% - 25% on average; however, this can vary greatly depending on the industry you operate within.
- Click-through rate (CTR)
Of the people who received your email, how many of them clicked a link within it? This metric is known as the click-through rate (CTR). You can calculate CTR by dividing the number of link-clicks by the number of people who received your email, then multiplying this number by 100.
CTR is not to be confused with the click-to-open rate (CTOR); this metric essentially records how engaging the content of your emails are. CTOR can be calculated by dividing the number of unique clicks by the number of unique opens and multiplying that figure by 100.
- Unsubscribe rate
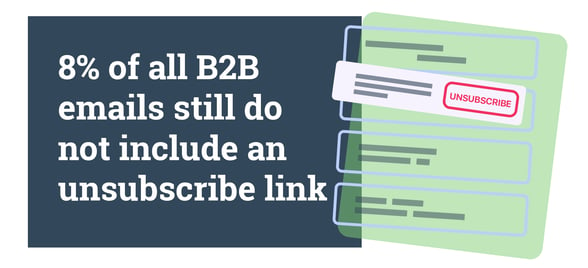
Under GDPR, every email you send must have a clearly visible unsubscribe button that gives recipients an easy way to stop receiving your brand’s marketing emails. Because it’s easier than ever to unsubscribe, you need to make sure that your email lists aren’t deserting you at an alarming rate.
The average unsubscribe rate is said to be 0.17%; you need to continually monitor yours as a high rate could indicate a poorly-targeted campaign, and irrelevant or even annoying content.
 Source: SuperOffice
Inbound Lead Generation Metrics
If you’re operating in a B2B space or merely trying to build your email lists, inbound lead generation should be an essential part of your strategy. Creating content that draws attention to your website and requires users or leads to submit their contact information to access that content.
- MQL conversion rate
MQL stands for Marketing Qualified Lead and is an acronym used to describe how many new leads have been generated from gated content.
Based on the website traffic that you have already recorded, you can figure out your MQL conversion rate. It’s helpful to set yourself a weekly goal of MQLs to hit, but make it realistic and based on data like your previous conversions.
- MQL source
So, you know that you’re bringing in 40 MQLs a week, that’s great. Do you know where they are coming from? Knowing which traffic source is bringing you the highest converting traffic can help you understand where to focus your efforts.
If you have a CRM system, like Hubspot, you can easily find and categorise the source of your MQLs.
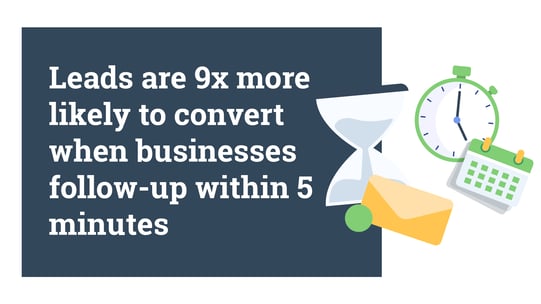
- MQL to SQL conversion rate
An SQL is a Sales Qualified Lead; for this metric, we measure how qualified your MQLs are to become customers. In other words, how many MQLs were able to advance stages and speak with a sales representative?
Each business will qualify their leads differently, so first you must figure out what your sales reps need from a lead for them to be open to taking them on as an SQL.
The average MQL to SQL conversion rate is 13%, where do you measure up?
 Source: SWZD
Revenue Metrics
No matter how customer-focused you are in your marketing efforts, all business comes down to one thing: revenue. If you’re not generating revenue, you’re finished. So, here are some metrics that will help you keep on top of what you’re making.
- Revenue growth
The metric revenue growth measures the increase or decrease in revenue over a period of time. It’s recommended that you track this monthly.
To calculate revenue growth, take your sales revenue from the first month and subtract it from the second month’s revenue. Then divide the result by the value of the first month, and multiply that by 100.
For example, if in month one you made: £2,000, and in month two you made £5,000, then you would perform this calculation:
RG = (5000 - 2000) / 2000 x 100 = 150% increase
- Return On Investment (ROI)
Put simply, calculating your ROI means asking yourself one question: after all the money we spent on marketing costs did we generate a profit?
To do this, you need to know the following values: Amount gained, which you can calculate using the revenue growth metric we discussed above, and amount spent, which is the total value of your marketing spend for that period (to include PR, ad spends, print costs, etc.).
ROI = (Amount gained - amount spent) / amount spent x 100
For example, if your marketing campaigns for February gained 300 sales totalling to £5000 and your total marketing spend was £3000, then your calculation would look like this:
ROI = (5000 - 3000) / 3000 x 100 = 66.66% ROI
- Customer Acquisition Costs (CAC)
For a long time, web-based businesses have used this metric; however, it can be beneficial to many other industries as more marketing teams take advantage of digital advertising.
Customer acquisition measures how much money it takes for your strategy to convert a customer. If customer acquisition costs are too high, it can be a silent killer for your business.
You can calculate CAC using the following formula:
CAC = Cost of Sales + Cost of Marketing / Number of Customers Acquired
Omnichannel metrics
As the use of big data in marketing becomes more pervasive, companies are pushing to make data-driven decisions that contribute to an omnichannel experience for their customers. Omnichannel marketing simply means using several marketing channels and ensuring that all of these channels are seamlessly connected, with integrated data.
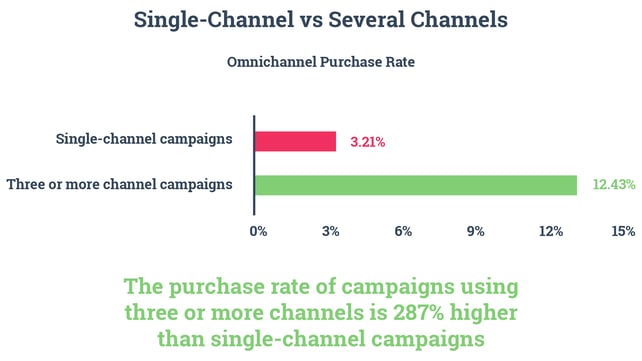
Source: OmniSend
Measuring the success of your omnichannel efforts is not a direct metric; however, you can get a good picture of how well you’re doing by measuring the following metrics:
- Customer Retention Rate
Retention is your ability to keep your customers returning to your business and making repeat purchases or continuing a subscription over time.
To calculate customer retention, you need to know the following values:
Number of customers at the end of the period = CE
Number of new customers during the period = CN
Number of customers at the start of the period = CS
Then you can use this formula:
Customer Retention = [(CE - CN) / CS] X 100
You can do a lot to increase your customer retention rates. To find out more about retention strategies, read our blog here.
- Customer lifetime value (CLV)
By calculating your CLV, you estimate that the amount of money a customer is likely to spend on your product or service during their lifetime. It’s a powerful metric as it can help you make data-driven decisions about how much you should spend on customer acquisition - if your CAC outweighs your CLV, you’re going to lose money.
CLV varies depending on your products or services and your customer retention rates - which will be longer if you’re delivering great omnichannel experiences.
CLV follows this formula:
CLV = average value of a purchase X number of times the customer will buy each year X average length of the customer relationship (in years)
For example, if you’re a coffee brand selling ground coffee via an e-store with a monthly subscription package, your calculation may look like this:
16.99 per bag of coffee x 12 bags a year x 3 years = £611.64
- Customer Satisfaction rate
Finally, customer feedback is some of the most valuable data that you can collect. Measuring how satisfied your customers are with your service, products and support, is a definitive metric, straight from the source.
The Net Promoter Score (NPS) was created for just this purpose; it’s a scale from 0-10 that asks your customer to answer one simple question:
How likely are you to recommend our brand to friends and family?
The results are divided into three categories: Promoters, Passives and Detractors. Then your NPS is measured by subtracting the percentage of detractors from the percentage of promoters.

Source: Zonka
As a marketer, making data-driven decisions is essential, but there’s no way to do that if you don’t know how to interpret your data. This bumper list of marketing metrics is the perfect place to start your data analytics journey.
All these numbers, formulas and definitions may seem like a lot to keep track of; however, without monitoring these key metrics, you’ll be operating your marketing strategy like a shot-in-the-dark. It’s time to turn those lights on and see your path to data-driven success.
If you’re struggling to become an omnichannel brand, why not book a demo of Hurree’s data unification and segmentation platform or email any of your questions to me at contact@hurree.co. It’s time to get your tools talking and we can help you do it!
Share this
You May Also Like
These Related Stories

How to Decrease Inactive Users with Email Marketing

How to Create the Perfect Content Marketing Campaign

![The Essential Guide to Data Integration [Read Now]](https://no-cache.hubspot.com/cta/default/2080894/6c447d2d-2712-496c-afa9-92ab34794721.png)
