The nature of working in a marketing agency is one of extremely high pressure. Marketers will need to successfully juggle numerous projects and deadlines, work with multiple teams and client types, often with high expectations, while also managing their own marketing efforts for the agency itself. It is an exceptionally busy working environment and therefore it is understandable that it can become overwhelming, particularly when the majority of clients want a regular, open stream of communication and expect to see results fast.
It is vital that the agency creates trust and builds a good relationship with their clients if they want it to be long-lasting and successful. One way to do that, and to make their own lives easier, is to provide client reports quickly, ensuring they are easy to interpret and understand. While each report is specific to each client and metrics tracked in one may not be tracked in another, the importance of pleasing the client with readily available and quick reports should not be overlooked.

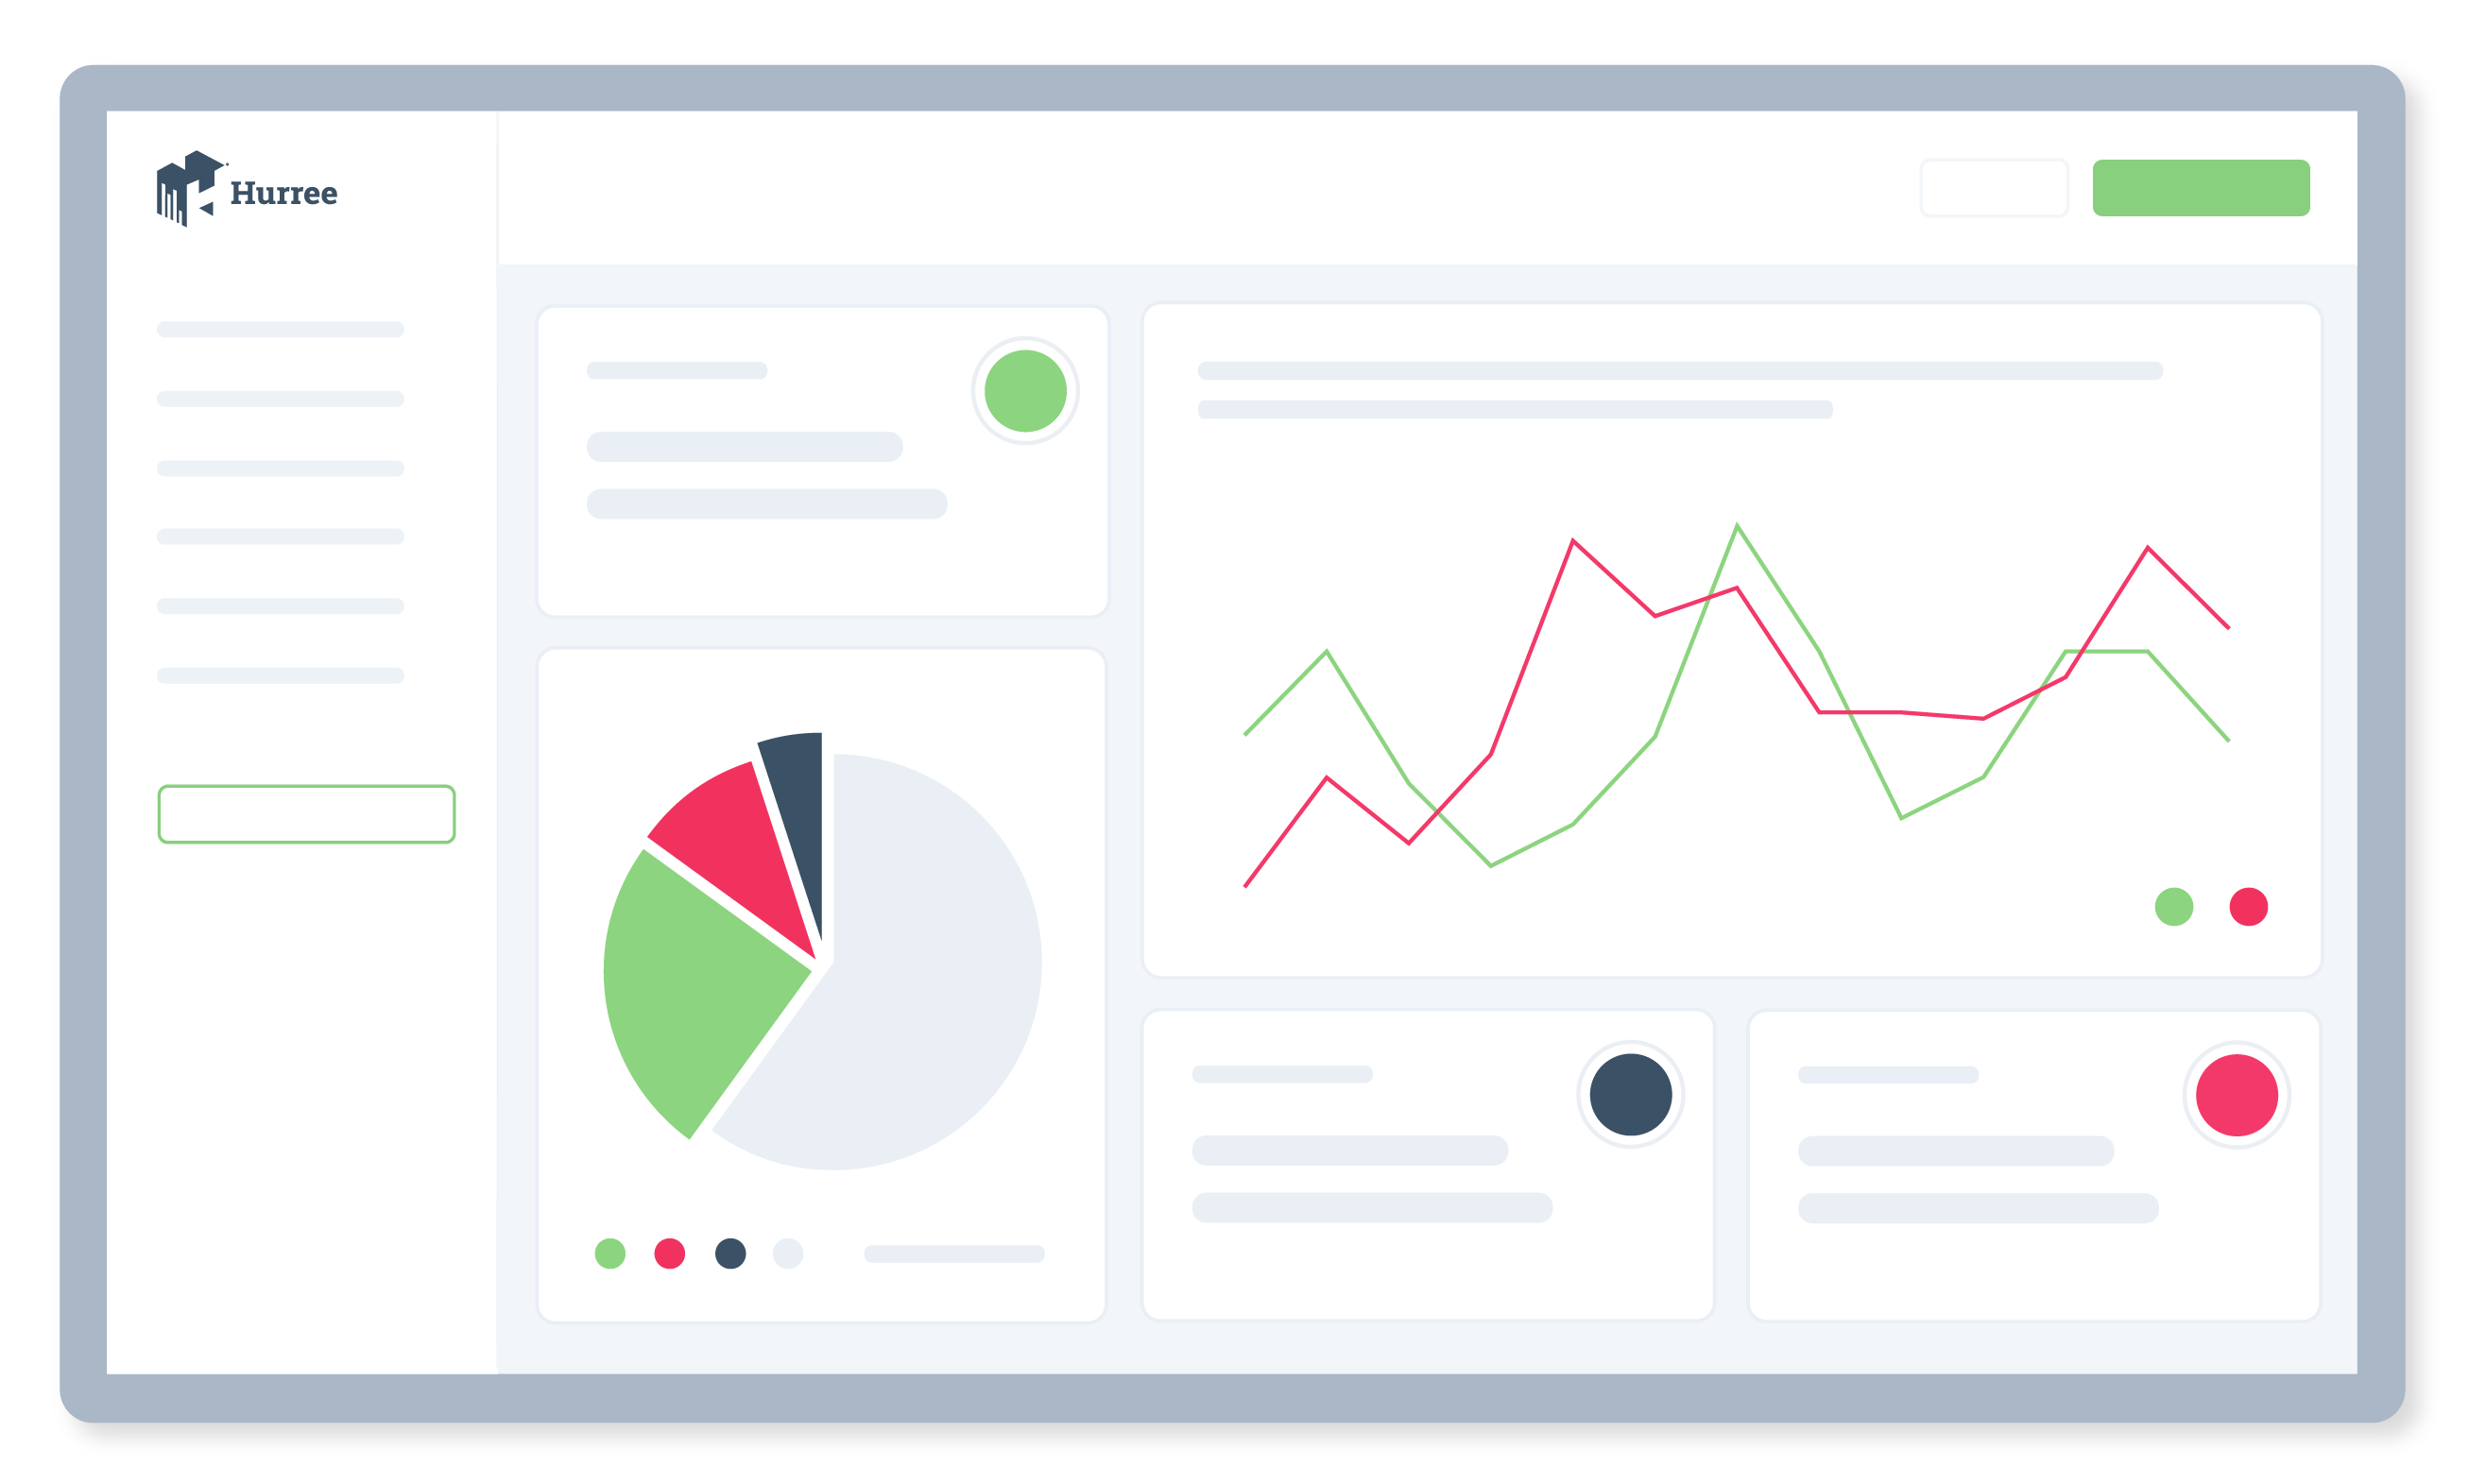
Why use a marketing dashboard?
Working in a highly competitive market, it can be difficult to stand out from the crowd. Many brands are beginning to bring their digital marketing expertise in-house, meaning there are fewer opportunities to acquire new clients, making customer retention more important than ever.
To run a successful marketing agency and keep your clients happy, you need to be able to showcase the performance of campaigns, highlight the value of your services and show that your client is getting a good return on their investment. Reporting the progress of marketing activities to the client should not be a painful or time-consuming process. Each account manager within the agency has multiple clients who expect regular updates on their projects. Preparing these individual client reports can become an extremely laborious and cumbersome task, however this is not the case when using the right tools, such as an automated marketing analytics dashboard.

Marketing dashboards can provide a unified experience for your clients to view and understand campaign performance, without which hours may be wasted manually collecting and combining data to retrieve the same insight. A real-time marketing analytics dashboard will allow agencies and their clients to pick and choose the metrics that clearly show the progress and performance of their efforts. Before starting any type of marketing campaign, however, you need to know how you’re going to define success. What is important to one client may not be to another, so it’s crucial you have a clear understanding of the goals of each of your clients.
For example, a startup SaaS company will focus highly on customer acquisition costs and monthly recurring revenues, whereas an e-commerce company will focus on the average order value and shopping cart abandonment rate. The KPIs and metrics you use to measure will also change based on the type of campaign you’re running, whether it’s an SEO, PPC or email campaign, where data will be collected from various different tools.
Benefits of using a marketing dashboard
Regular collaboration with clients
Communicating with your clients is vital. By regularly providing them with campaign updates by way of a marketing dashboard, you keep your clients actively involved in decision making processes and future planning. Your clients will have a greater sense of what activities are taking place and have the opportunity to ask questions and request changes. By engaging with your clients in this way, you naturally build and increase rapport with them, making it much more likely that they will remain loyal to your agency.
Effortless management of multi-client data
Collating reports, graphs and tables for multiple clients is a very time consuming process, especially when you obtain the data from different sources and tools. It can be very easy to make a mistake in the figures or copy and paste the wrong information into the wrong client report. By using an automated marketing dashboard, all you need to do is set up the metrics and KPIs for each client and let them automatically update, saving you valuable time and resources.
Share dashboard snapshots instantly through a link or email
Clients often expect their account managers to reply immediately with results from campaigns, however this is often not feasible. By using a marketing dashboard, you can quickly export the data as a snapshot and share it instantly with your client. With Hurree, you can share this directly to your client’s inbox, or generate a sharable link that anyone can view. So the next time your client asks how well their marketing campaign is performing, you can reply within minutes with the information they need.
Confident and clear decision making
The benefit of viewing progress on a marketing dashboard is that it gives a clear view of how activities and campaigns are performing. It is easy to overwhelm your client by providing them with too much information, which may result in your client making decisions that aren’t based on relevant data. With a KPI dashboard, your client has real, visible data points that can be used to help in data-driven decision making, rather than decisions based on their intuition or gut feeling.
Visual and straightforward campaign reporting
Providing key values in a dashboard format is much more visually engaging and provides the client an at-a-glance, clear overview of how a campaign is performing. Visual information has been proven to improve the human brain’s ability to understand and interpret information faster.
Examples of KPIs that marketing agencies should track
While it would be impossible to give a definitive list of KPIs that each marketing agency should include in their dashboard, there are a few that should be included that will give the client reassurance and data to show that the money they are spending with your agency is being put to good use. Here are a few examples of what you should be tracking frequently:
1) Website traffic to lead ratio
Most often, a website is the first point of contact a customer typically has with a business. Tracking the percentage of visitors that come to your client’s site who turn into actual leads is important because if they are not converting, then something is going wrong.
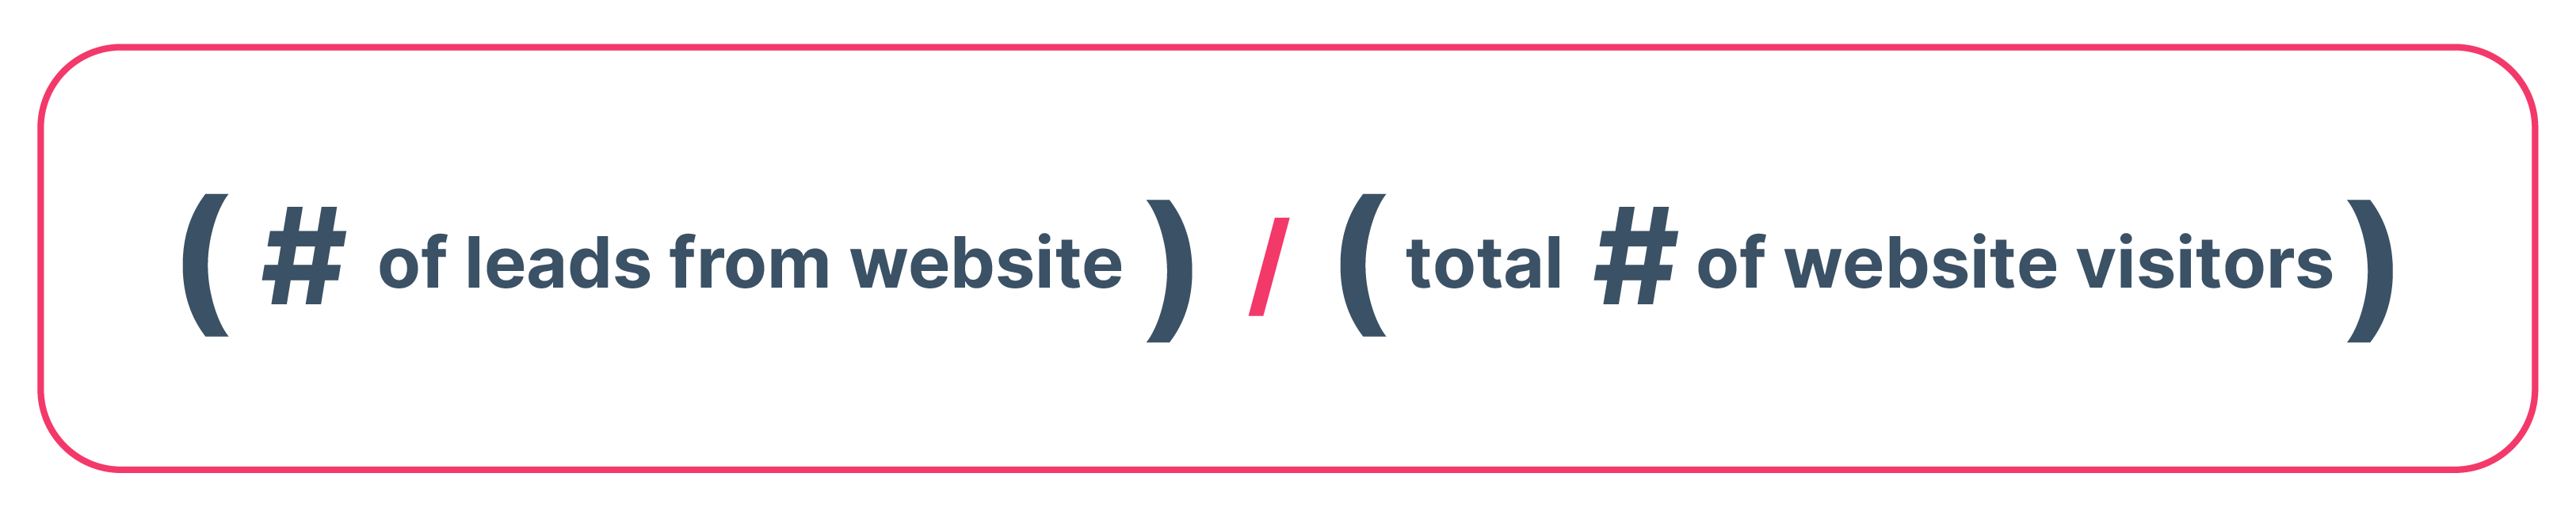
Tracking these figures allows you to make tweaks to ensure that more website traffic turns into customers. You can use the formula to calculate the conversion rate at different points on the website and improve where necessary by updating landing pages, CTA’s, pop-up forms, copy, or by adding customer reviews and testimonials.
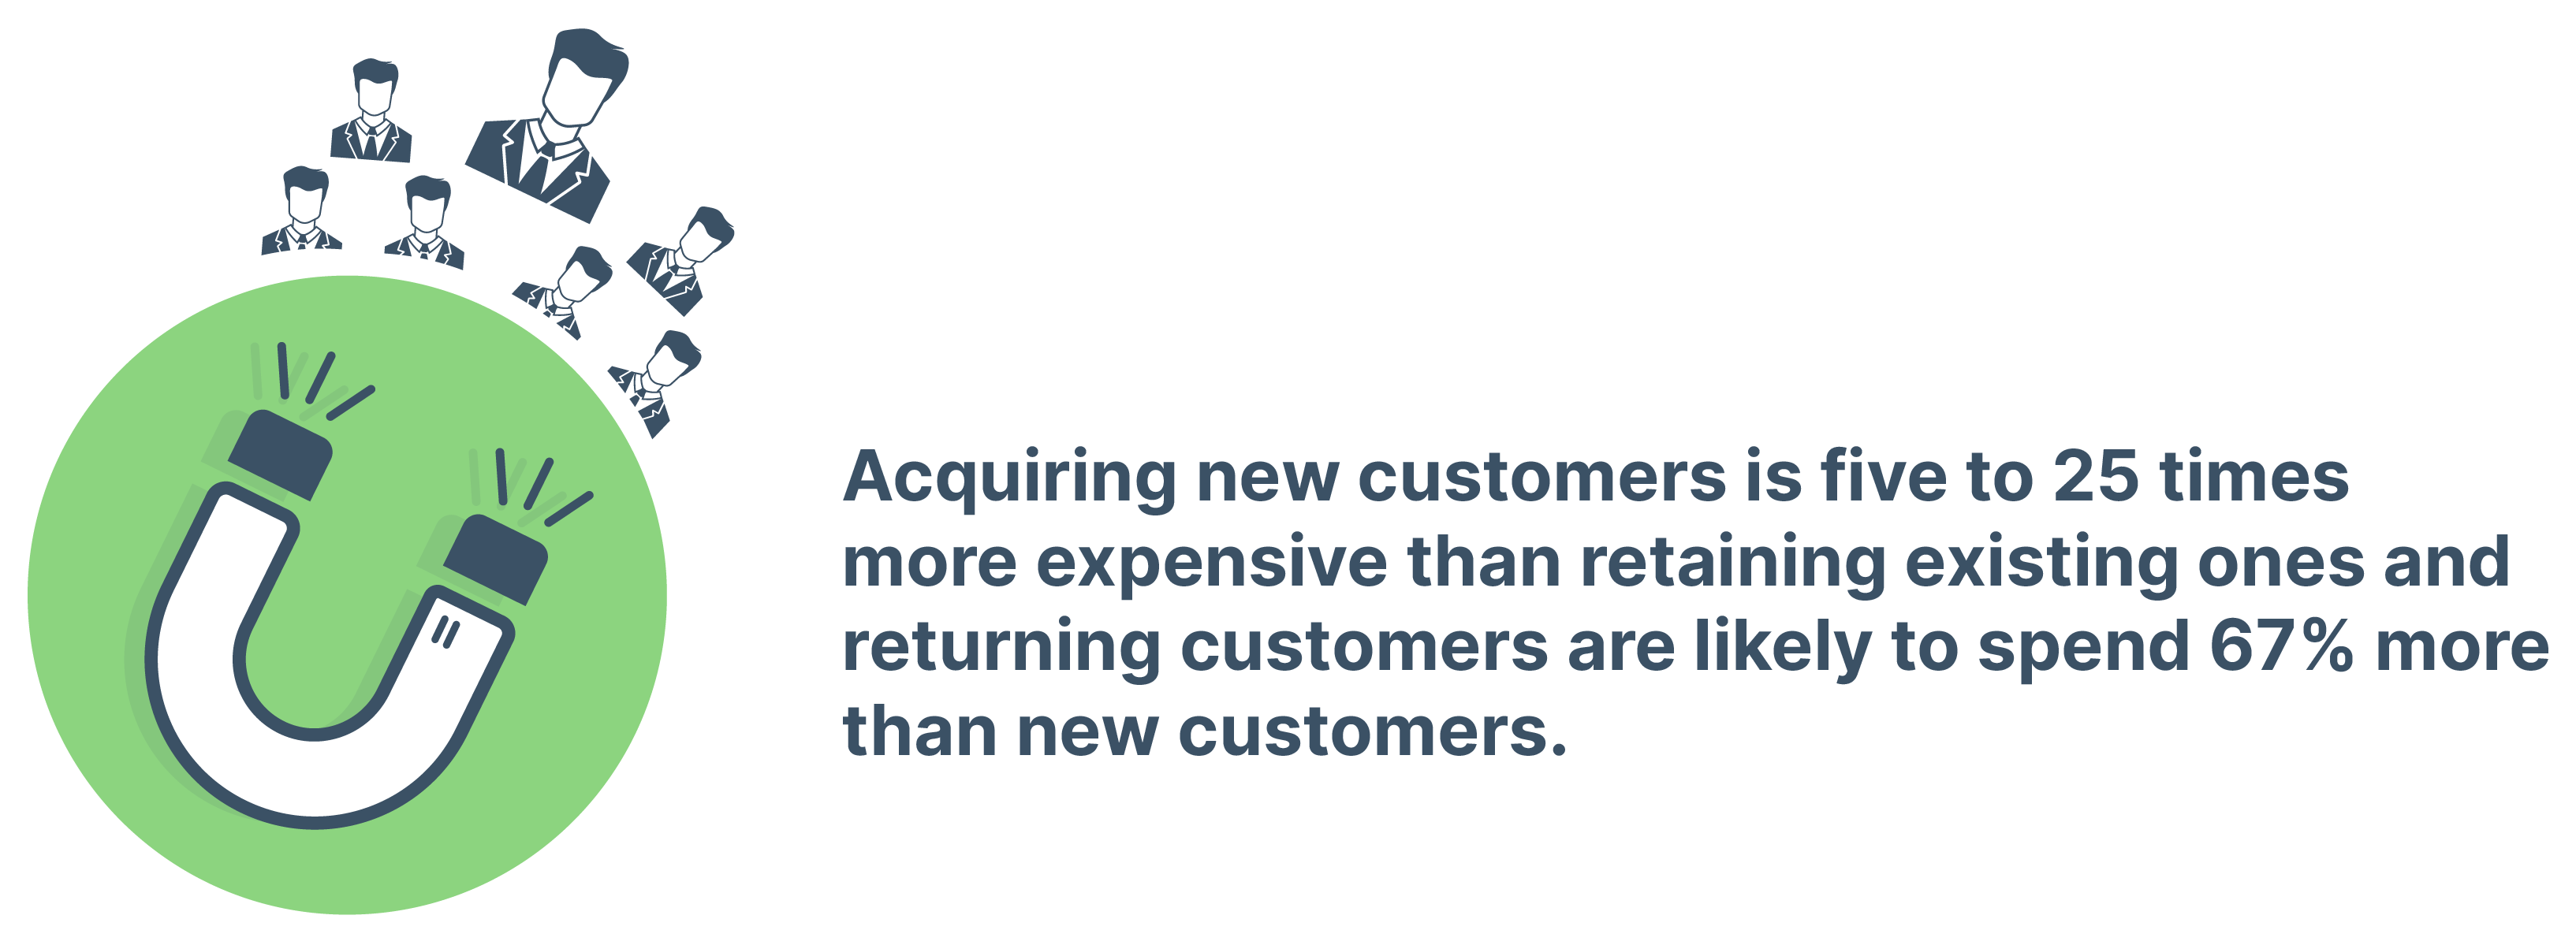
2) Customer lifetime value
Customer lifetime value is the total amount of revenue a customer generates throughout their relationship with a business. Tracking CLV is essential for evaluating the potential and future success of the business. Until you know how much money you can generate from an average customer, it will be much more difficult to know how much to spend on acquiring a new customer. Once you know what you can gain from a typical customer, you can increase or decrease spending to ensure you maximize profitability and continue to attract the right types of customers. An increasing CLV highlights that you are keeping your clients’ customers happy, reducing customer churn and connecting with leads the right way.
3) Marketing qualified leads (MQLs)
Ideally, you want visits to your client’s website to increase, but what good is it if they don’t convert into viable leads that are likely to buy? An MQL is a lead that has engaged with your client and could become a more serious prospect if you nurture the relationship. Examples of marketing qualified leads include those who have:
- Signed up to a software demo or trial
- Submitted an email address for a newsletter or mailing list
- Added items to their shopping cart or favourited an item
- Visited the site repeatedly or spent a long time browsing
4) MQL to SQL conversion ratio
Out of all your MQLs, how many move on to become a sales qualified lead (SQL)? Unlike an MQL who has potential to become a serious prospect, an SQL is deemed as ready for a direct sales follow up from the sales team. Monitoring the number of MQLs that convert into SQLs is one of the best ways to determine the overall quality of leads and is a great indicator of how well your lead generation and lead nurturing strategies are working. When adding this metric to your dashboard, you may want to consider tracking the following metrics to help provide context for the figure:
- Average sales cycle length
- SQL to win conversion rate
- Average purchase value

5) Customer churn
This is the percentage of customers that stop doing business with a company after a certain period of time. You can calculate churn rate by dividing the number of customers lost during a time period by the number of customers there was at the beginning of that time period. In an ideal world, once a customer buys from your client, they will remain loyal. As we all know, this isn’t always achievable, so some degree of customer churn is normal. Monitoring the customer churn rate is important as a high churn rate suggests your client’s customers are not receiving the desired value from the product.
Source: Harvard Business Review
6) Social media conversion rates
This is the number of users who perform the actions outlined in a social media post ,e.g subscribing to a mailing list, visiting a landing page, or making a purchase. Having a high conversion rate shows that the post is delivering value to your client’s audience and suggests the content is relevant to their followers.
While conversion rate is important to monitor, agencies should also consider other social media metrics such as:
- Engagement - The number of likes, comments, shares and general interactions that a social post receives. An account with lots of followers is pointless if the audience isn’t regularly interacting with the content.
- Follower growth rate - The speed at which your client’s brand following increases. It’s obvious that you want to gain more followers than lose them.
- Post reach - This is used to determine who sees the content. It could be the number of people who saw a tweet, an Instagram story, or a Facebook event page.
- Site traffic from social media - Looking at the traffic to your client’s website is a good way to see how effective social posts with website links are performing. If you invest a lot of time and effort into your client’s social media content, you want to make sure there is a high percentage of website traffic coming from those channels.
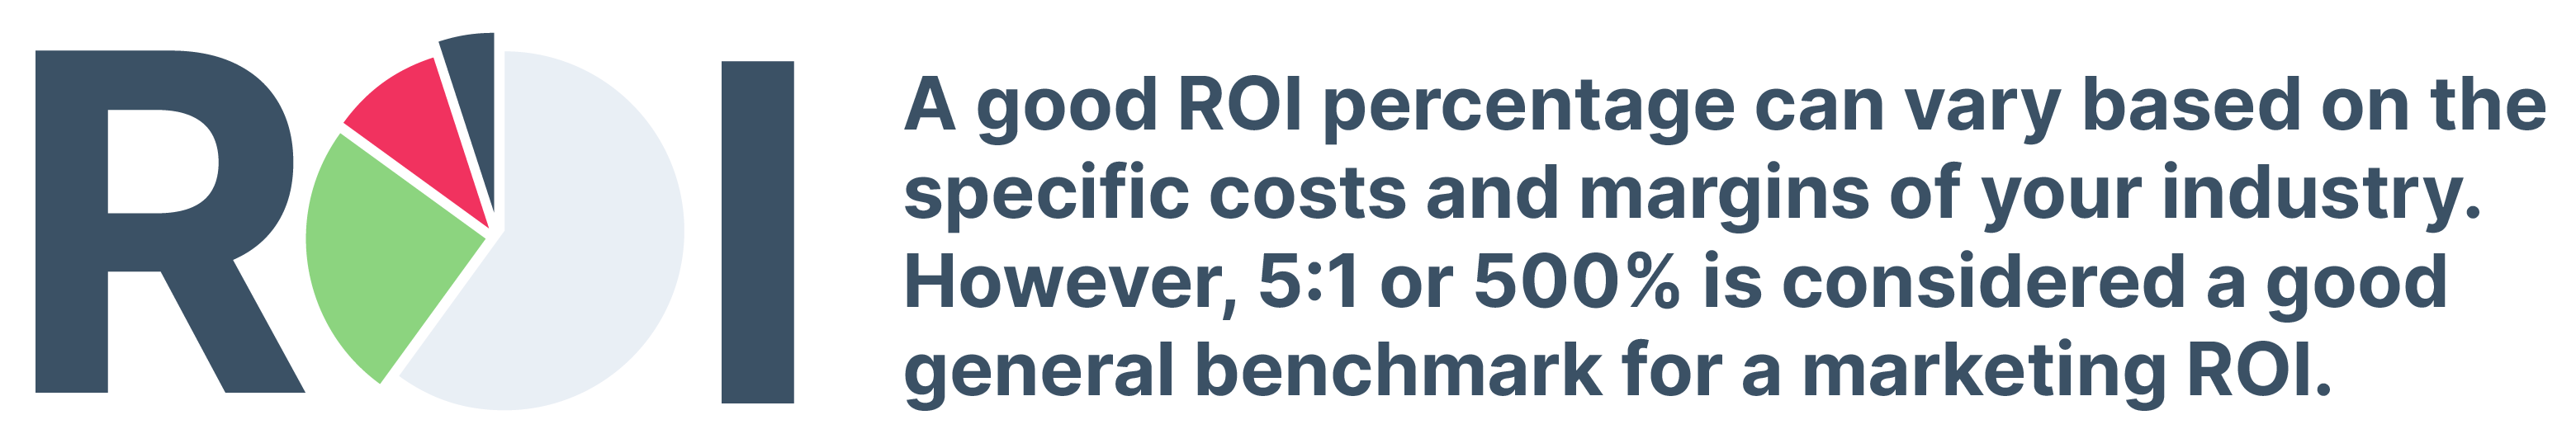
7) Return on investment (ROI)
This measures how much profit is generated from a campaign and will be of particular interest to your client. Your clients want to know that the money they are investing in your agency is being well spent and generating valuable leads and revenue. The ROI reflects the profit generated from a specific campaign after subtracting the costs associated with the campaign. Once ROI is calculated, it can be used to justify marketing spend and budget allocation for ongoing and future campaigns and initiatives.
 Source: Web Strategies
Conclusion
While the metrics above are a great starting point, they are not an exhaustive list. Depending on the requirements and goals of your client, the KPIs that are most crucial to track will change. The perfect marketing agency analytics dashboard will include all the KPIs that provide you and your client with enough information to understand the bigger picture of their marketing performance, without overwhelming them with unnecessary detail. Reporting in the form of an automated dashboard quickly shows how well your strategies are performing and makes it much easier to discuss future expectations and plans because you are all working from the same data.
Track and visualise your KPIs in real-time with Hurree. Book a free trial today and discover how to truly harness the power of analytics and transform your company reporting using cross-platform dashboards. If you have any questions then feel free to reach out to contact@hurree.co, we'd be happy to answer them!


Share this

[Infographic] 6 KPIs That Marketers Should Be Tracking

The 40 Most Important KPIs for Marketers