Big Data. It's a word that you've likely heard a lot, but what does it really mean?
Big data refers to large sets of raw data, data that are structured, semi-structured or unstructured. The data itself is collected from a variety of sources, ranging from business transactions and smart devices to photographs, videos, search engines and social media (to name just a few). This information is gathered, recorded, stored and analysed with the purpose of uncovering actionable insights that add further value to your brand.
![The Essential Guide to Data Integration [Read Now]](https://no-cache.hubspot.com/cta/default/2080894/6c447d2d-2712-496c-afa9-92ab34794721.png)
The thing is, big data isn't just a static entity; it's constantly growing as technology becomes more sophisticated, widely used and depended-upon by businesses and individuals alike.
The good news for marketers is that this wealth of information can be utilised to optimise decision-making, streamline your marketing strategy, elevate customer & user experiences, improve product development, and more!
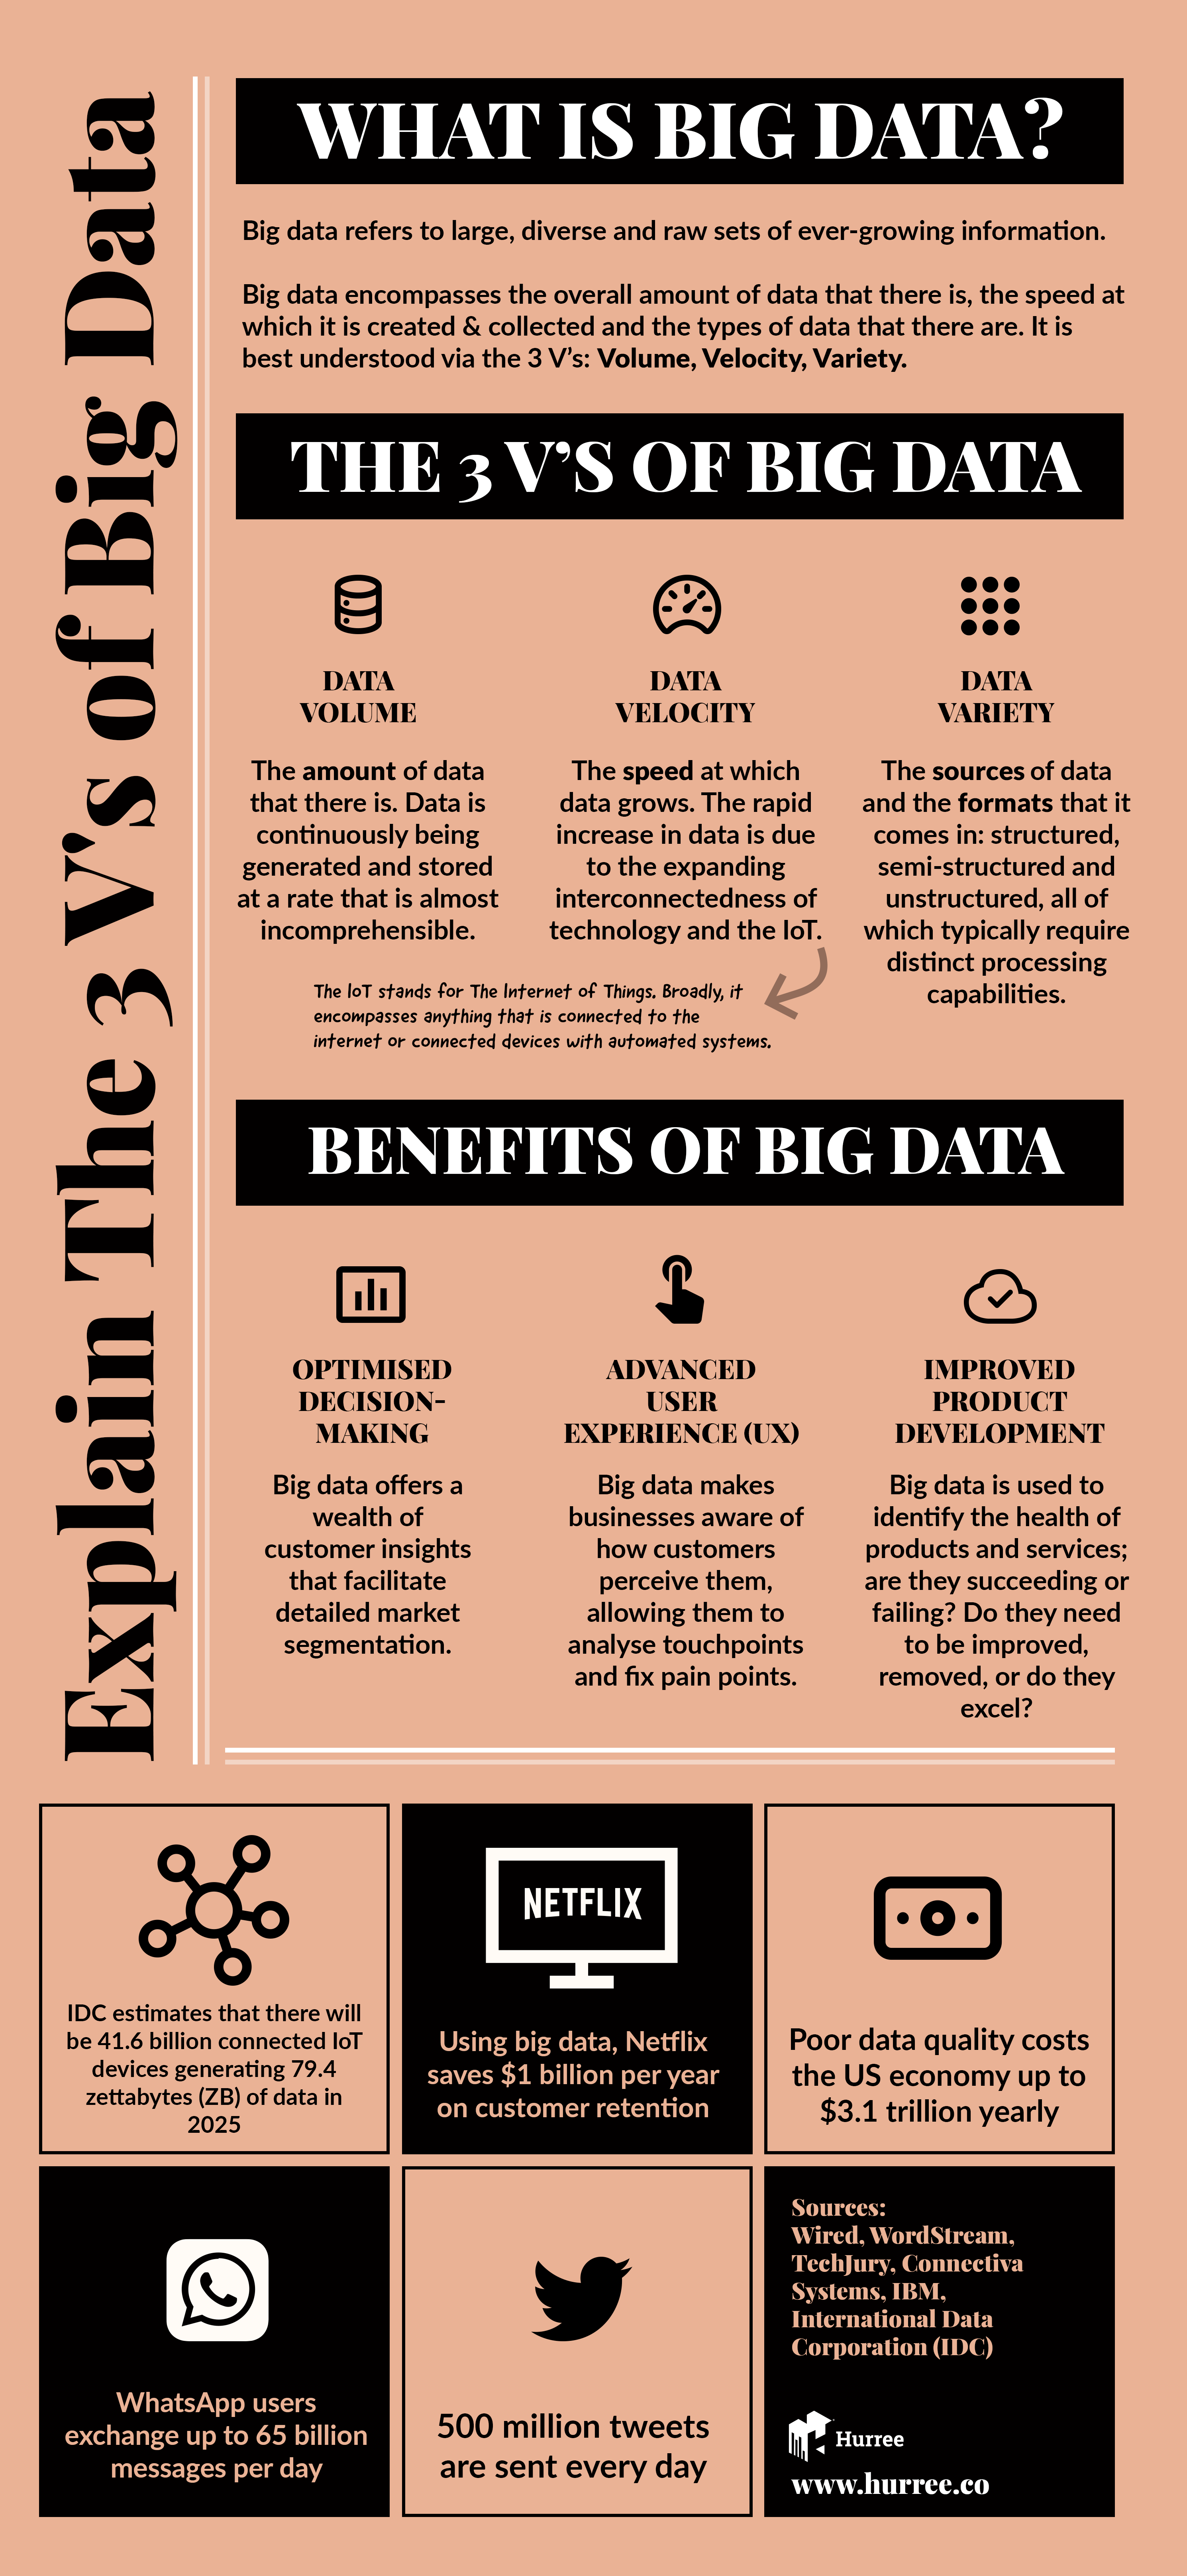
Nevertheless, big data can, overall, be a confusing concept - especially when data doesn’t come from just one single source or appear in one format. Luckily for us, big data can be explained in terms of the 3 V's: Volume, Velocity, Variety.
Volume:
The amount of data that there is. The volume of data that there currently is globally is practically incomprehensible. According to a report from IBM Marketing Cloud, 90% of the data in the world today has been created in the last 2 years. With new technologies and devices emerging so frequently, it’s undeniable that this growth rate will continue and, likely, surge.
Velocity:
There’s more data now than ever before. Velocity refers to the increasing rate at which data grows. The way that people & businesses now utilise technology and consume products is ever-increasing and, as a result, so is the rapid acceleration of data. 80-90% of the data we generate today is unstructured; this has led to 95% of businesses claiming that the need to manage unstructured data is a problem for their business.
Variety:
In the not-too-distant past, data was once collected, delivered and analysed in one, simple format; typically database files such as Excel, CSV, etc. Fast forward to the present and we are inundated with a variety of different formats. The data landscape has been carved and moulded by big data; of course, traditional formats still exist, but other, more modern types of data have come into fruition, such as graphics, video, audio, and so on. The uniqueness and variety of modern data formats mean that businesses and marketers need to find new ways of storing, processing and analysing this valuable data.
Research shows that more than 63% of marketers claim to have increased their spending in this area. In fact, around 20% of all marketing spend today goes on data-driven campaigns. This is because it has been proven that data-driven marketing works.
Take a look at this infographic where we explain the 3 V's of big data:

Share this Image On Your Site