Marketers are driven by data. Testing, industry benchmarks, worldwide trends - these are all elements that inform our own marketing strategies and content.
Data and statistics are especially important when you’re putting together a marketing strategy and trying to justify the rationale behind your decisions. While we’d all like to think our opinions should be the driving force, having data to show what you’re doing and why you’re doing it will always be important.
However, we don’t all have the time or budgets to generate our own data and sifting through thousands of pages of data on the internet is not exactly time efficient. That’s why we’ve put together this list of stats from sources we use everyday here at Hurree, that every marketer should know to ensure their marketing strategy is driven by data.
Social media stats
- As of January 2022, there are 3.96 billion total social media users across all platforms. (Statista)
- The fastest growing social media platform is TikTok.
- A pandemic platform - in 2020 TikTok grew by 87% (that growth slowed a bit in 2021 - 18.3%). (Oberlo)
- Over 1 billion videos are watched every day on TikTok. (Techjury)
- 62% of TikTok users say that platform-specific branded content is the best way to connect to customers. This signals the need for unique posts on TikTok, not just repurposed content. (Sprout Social)
- The globe has 4.8 Billion internet users, and TikTok is used by 20.83% of them. (Demand Sage)
- More than half of the world now uses social media (59%). (Smart Insights)
- Worldwide, people spend an average of 2 hours and 27 minutes per day on social media. (Statista)
- In 2021, the global social media advertising spend was $154 billion. (Hootsuite)
- Almost an entire third (33.1%) of the total global digital ad spend came from social media. (Hootsuite)
- As of 2022, Facebook usage and activity are down to 33 minutes per day on average (versus 39 minutes daily in 2017).
- Facebook remains the most-used platform by marketers worldwide (93%). Instagram sits in second place (78%). (Sprout Social)
- 58.4% of global internet users buy something online every week. 30.6% of those make a purchase on their mobile device. (Hootsuite)
- Consumers are six times more likely to make a purchase from a product page that includes pictures from social media. (Nosto)
- In the UK, 28% of internet users use social media for brand research. This highlights the importance of social shopping.
- Only 17% of UK social media users follow influencers. (Avocado Social)
- YoY social media growth
- 2021: 4.480 billion active users (+13.13%)
- 2020: 3.960 billion active users (+13.7%)
- 2019: 3.484 billion active users (+9.2%)
- 2018: 3.196 billion active users (+9.0%)
- 2017: 2.796 billion active users (+21%)
- 2016: 2.307 billion active users (+11%)
- 2015: 2.078 billion active users (Backlinko)

Internet usage stats
- More than two-thirds (67.1%) of the world’s population now uses a mobile phone, with unique users reaching 5.31 billion by the start of 2022. (Data Reportal)
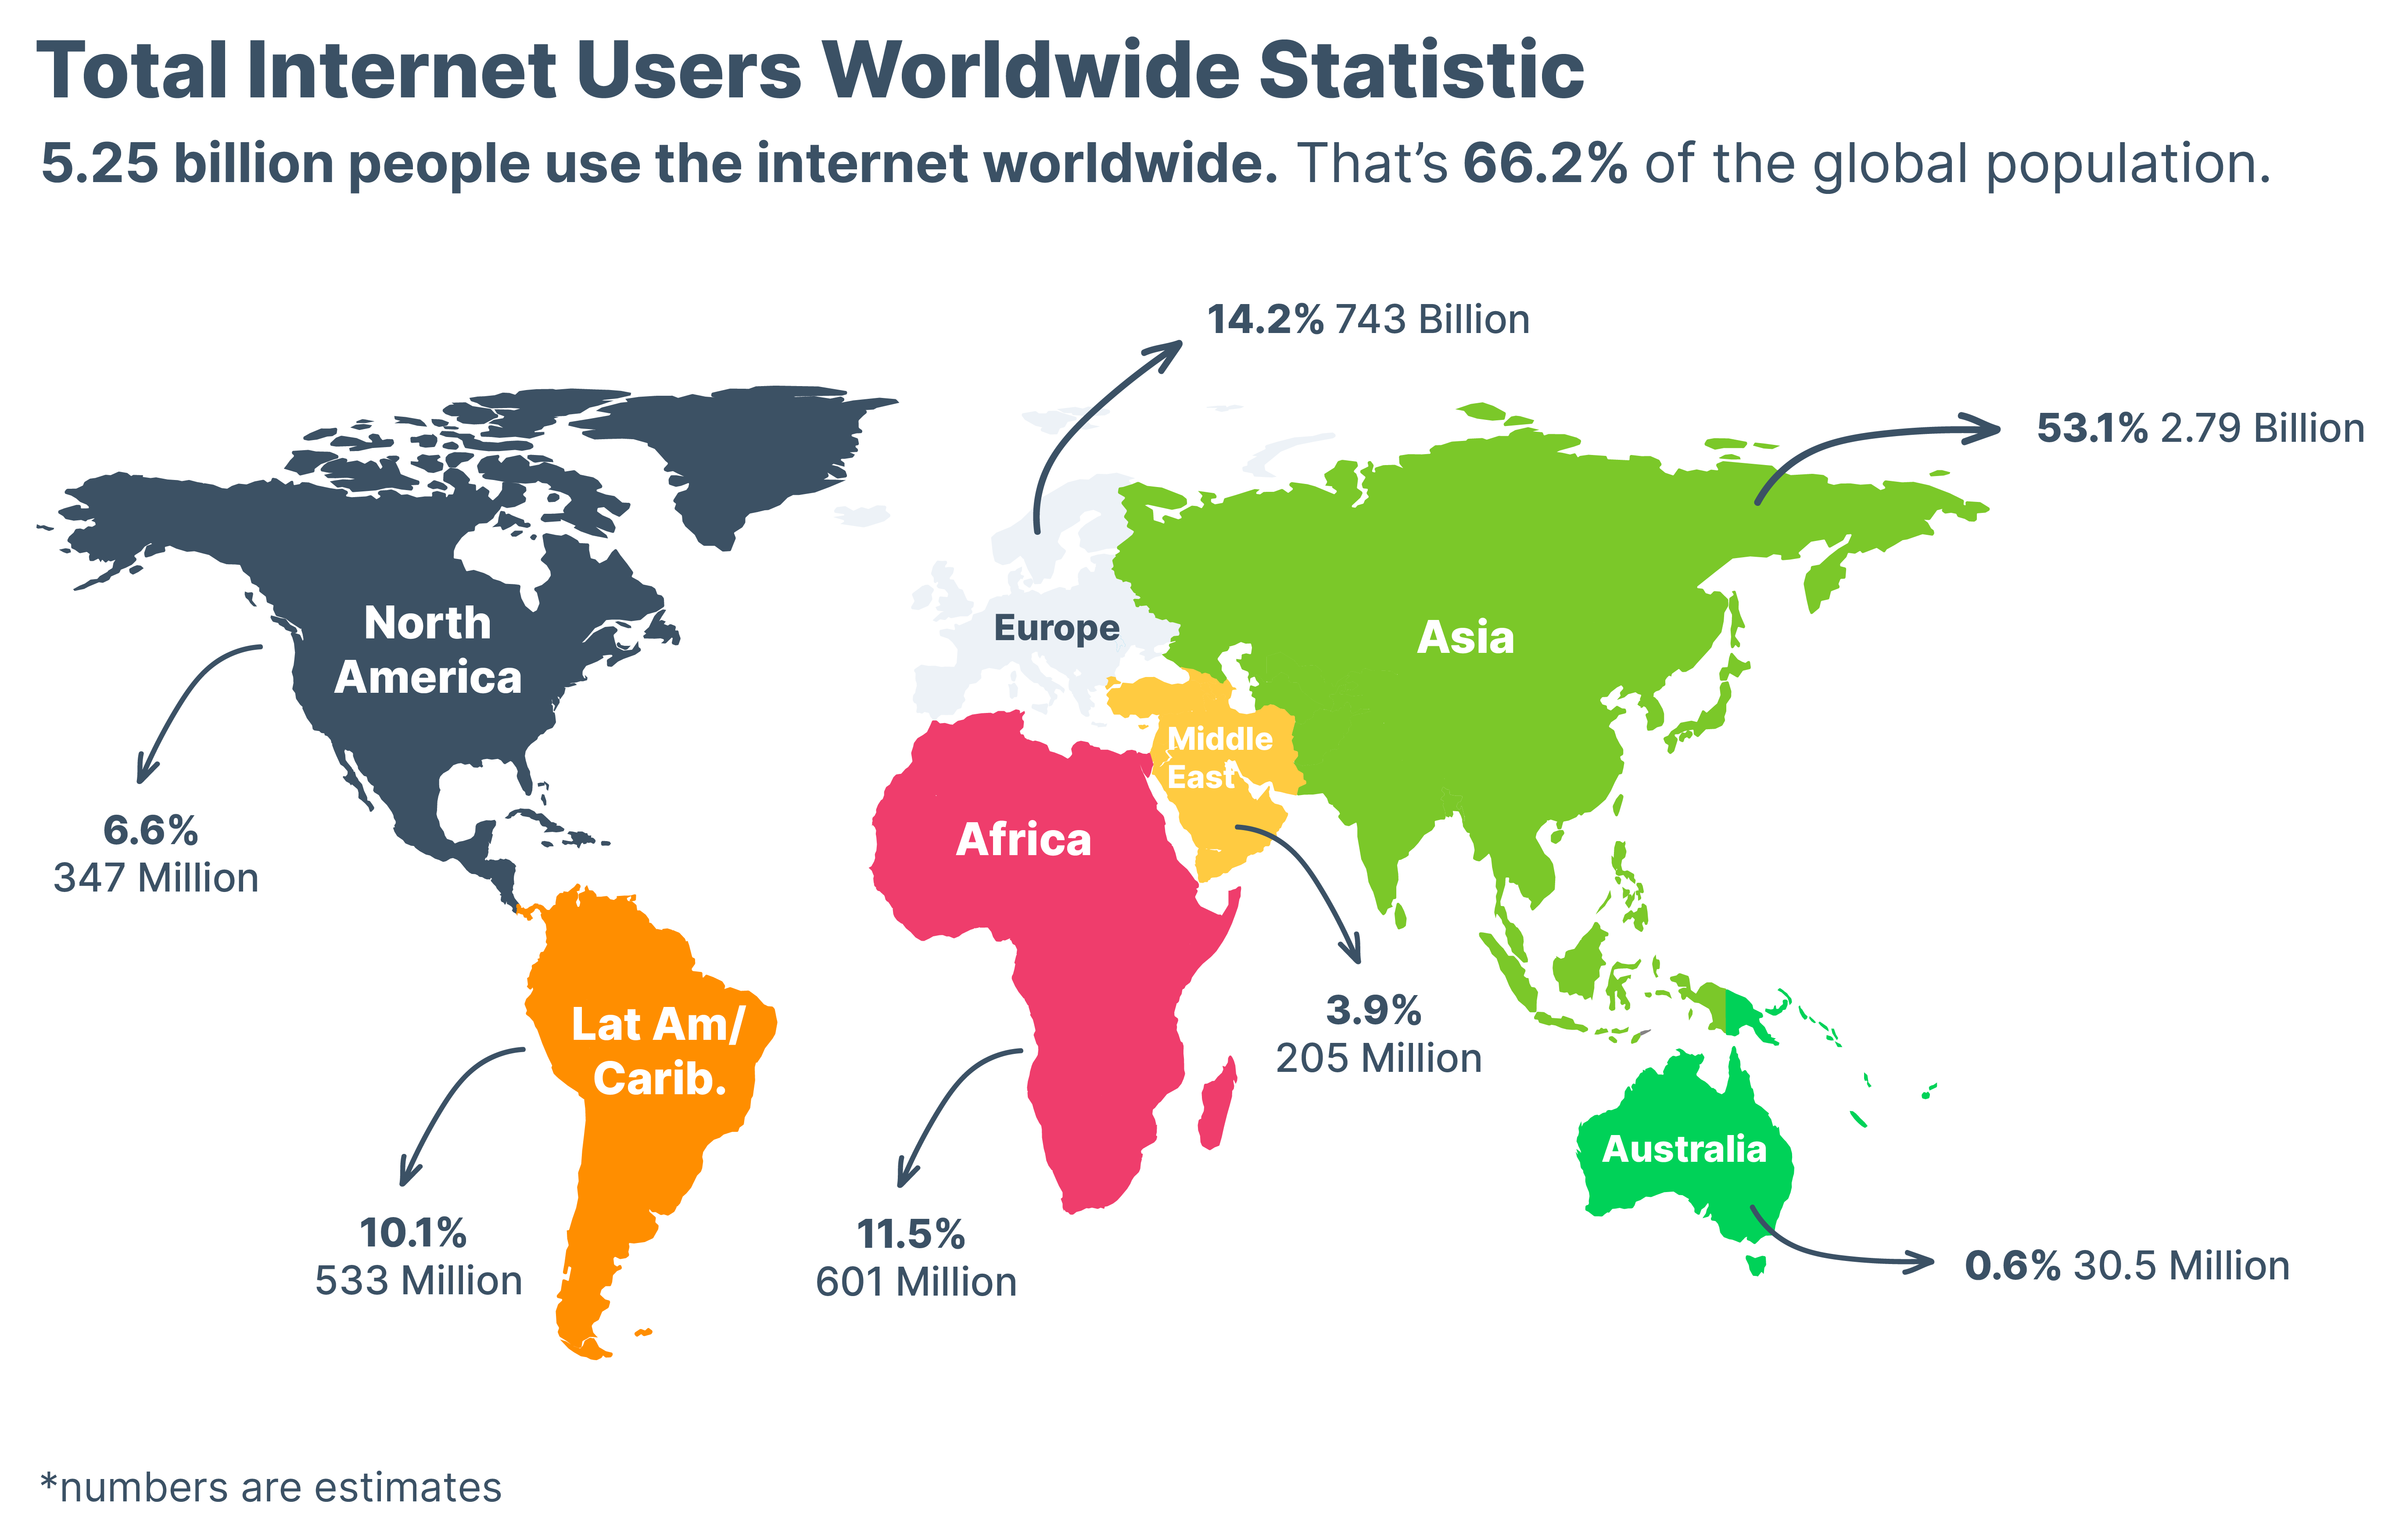
- Global internet users have climbed to 4.95 billion at the start of 2022, with internet penetration now standing at 62.5% of the world’s total population.
- Kepios analysis reveals that internet users have more than doubled over the past 10 years, climbing from 2.18 billion at the start of 2012 to 4.95 billion at the start of 2022.
- The latest data suggests that internet users grew by 192 million over the past 12 months, resulting in annual growth of just 4% in 2021. (Data Reportal)
- Kepios analysis reveals that internet users have more than doubled over the past 10 years, climbing from 2.18 billion at the start of 2012 to 4.95 billion at the start of 2022.
- From 2002 to 2022 internet usage increased 1355%. (Broadband Search)
- In 2022, 54.4% of all internet traffic worldwide was conducted via mobile devices. (Broadband Search)
Source: Broadband Search
Email marketing stats
- There are 4 billion daily email users. This is forecast to be 4.6 billion by 2025 (more than half of the world’s population) (Statista)
- 33% of marketers send weekly emails and 26% send emails multiple times per month. (HubSpot)
- Email marketing revenue is estimated to reach almost 11 billion by the end of 2023. (Statista)
- Globally, Fridays see the highest email open rates (nearly 19%), compared to the lowest open rates (17%) on Saturdays. (Campaign Monitor)
- 81% of B2B marketers say their most used form of content marketing is email newsletters. (Content Marketing Institute)
- A majority of email views come from mobile devices (41%), followed by desktop (39%). (HubSpot)
Source: Statista
- In 2022, 333.2 billion emails are expected to be sent and received each day (Statista)
- Email ROI is extremely high. For every $1 spent, email drives $26 in revenue (Litmus)
- Email is the second most popular content distribution channel with 87% of marketers using it, just behind social media at 89%. (Content Marketing Institute)
- 46% of smartphone users prefer businesses to communicate with them via email (Statista)
- The most effective strategies for email marketing campaigns are: subscriber segmentation (78%), message personalisation (72%), and email automation campaigns (71%). (HubSpot)
- 15.8% of emails are caught in spam filters or go missing altogether. (Email Tool Tester)
Campaign Monitor collated email stats by industry
|
Industry |
Open Rates |
Click-Through Rates |
Click-To-Open Rates |
Unsubscribe Rates |
|
Advertising & Marketing |
20.50% |
1.80% |
9.00% |
0.20% |
|
Agriculture, Forestry, Fishing, Hunting |
27.30% |
3.40% |
12.50% |
0.30% |
|
Consumer Packaged Goods |
20% |
1.90% |
11.10% |
0.10% |
|
Education |
28.50% |
4.40% |
15.70% |
0.20% |
|
Financial Services |
27.10% |
2.40% |
10.10% |
0.20% |
|
Restaurant, Food & Beverage |
18.50% |
2.00% |
10.50% |
0.10% |
|
Government & Politics |
19.40% |
2.80% |
14.30% |
0.10% |
|
Healthcare Services |
23.70% |
3.00% |
13.40% |
0.30% |
|
IT/Tech/Software |
22.70% |
2.00% |
9.80% |
0.20% |
|
Logistics & Wholesale |
23.40% |
2.00% |
11.70% |
0.30% |
|
Media, Entertainment, Publishing |
23.90% |
2.90% |
12.40% |
0.10% |
|
Nonprofit |
26.60% |
2.70% |
10.20% |
0.20% |
|
Other |
19.90% |
2.60% |
13.20% |
0.30% |
|
Professional Services |
19.30% |
2.10% |
11.10% |
0.20% |
|
Real Estate, Design, Construction |
21.70% |
3.60% |
17.20% |
0.20% |
|
Retail |
17.10% |
0.70% |
5.80% |
0.10% |
|
Travel, Hospitality, Leisure |
20.20% |
1.40% |
8.70% |
0.20% |
|
Wellness & Fitness |
19.20% |
1.20% |
6.00% |
0.40% |
|
Average Totals |
21.5% (+3.5%) |
2.3% (-0.3%) |
10.5% (-3.6%) |
0.1% (-) |
Demographic stats
Gen Z: Born 1997-2012
Source: Zurich
- 40% of Gen Z use TikTok for search rather than Google. (TechCrunch)
- 85% of Gen Z prefer to interact with businesses using chatbots or other automations as opposed to phone calls. (Insider Intelligence)
- Only 39% of Gen Z trust companies to protect private data. (Insider Intelligence)
- 61% of Gen Z will pay more for brands they trust, and 71% will forgive and even recommend brands they trust who have made mistakes. (Edelman)
- 64% of Gen Z will pay more for environmentally friendly products. (Deloitte)
Millennials: Born 1980-1996
- As of 2020, Millennials accounted for 35% of the global workforce (Go Remotely)
- 33% of millennials use ad-blocking software. (99 Firms)
- A millennial is 247% more likely to be influenced by social media than a baby boomer. (Thrive My Way)
- 44% of millennials trust experts on social media even when they are strangers. (Thrive My Way)
- 80% of millennials want brands to entertain them. (Millennial Marketing)
- 48% of millennials find influencer marketing more authentic than traditional marketing channels. (Cure Media)
- 73% of millennials use their phones to shop online. (Adweek)
- 51% of millennials use search engines to find products. (99 Firms)
- 73% of millennials believe the internet to be a positive thing. (Cure Media)
Gen X: Born 1965-1980
- As of 2020, Gen X was estimated to make up 35% of the global workforce, with Baby Boomers only making up 6%. (Business Leader)
- 95% of Gen X uses Facebook. (Rev Local)
- 54% of Gen Xers feel overlooked by brands and marketers. (Marketing Charts)
- Nostalgia wins with Gen Xers - 75% watch YouTube videos that relate to past events or people. (Think with Google)
- Gen X spend ⅓ more annually than millennials. (Forbes)
- Email marketing is the most effective channel to reach Gen Xers. (MarketingProfs)
- More than 88% of Gen Xers join loyalty programs to save money. (Loyalty 360)
Search Engine and SEO Stats
- SEO as an industry is worth $80 billion in the US. (Statista)
- 53% of all website traffic originated from organic search. (Search Engine Land)
- An average Google search session takes less than a minute. (Moz)

Source: Forbes
- YouTube is the second largest search engine behind Google. (Global Reach)
- 96.26% of mobile search traffic is generated on Google. (StatCounter)
- Up to 20% of search queries on Google each day are unique and have never been entered before. (Internet Live Stats)
- 65% of all Google searches in 2020 ended without any clicks. (Search Engine Land)
- 49% of businesses say their best marketing ROI comes from organic search. (Search Engine Journal)
- The top Google Search result for any query gets about 32% of all clicks. (Backlinko)
- A good organic click-through rate (on average) is 3-5%. (Neil Patel)
- Brands that blog have an average of 434% more indexed pages than those that don’t. (SmallBizGenius)
- Blogs get 55% more traffic than their primary business websites. (HubSpot)
- 61% of marketers say generating traffic is their number one challenge. (Fundera)


Share this

The Top Marketing Trends of 2023

Statistics Every Salesperson Should Know in 2023