Black Friday is one of the biggest events of the year for many marketers and it’s easy to see why. From increasing brand awareness and engagement opportunities to customer acquisition and growing ROI, Black Friday campaigns can have a significant impact on your business.
But once the dust settles after the Black Friday frenzy comes a pivotal phase that often separates successful marketers from the rest – post-campaign analysis. Beyond the immediate surge in sales, understanding the intricacies of what worked and what didn't is crucial for sustained success. In this blog, we’ll delve into the significance of post-Black Friday analysis and explore how marketers can leverage data to refine their strategies for future success.
A quick history of Black Friday
Black Friday's origins lie in Philadelphia, where it was coined to describe the post-Thanksgiving traffic mayhem. Businesses, however, saw an opportunity to turn the narrative around, marking the day when their financial ledgers shifted from "red" to "black." By the 1970s and 1980s, it became a national event in the United States. Characterised by early-morning store openings, the day became a day for sales and discounts for many large retailers.
As years passed, Black Friday evolved into a strategic marketing opportunity. By the 2000s, Black Friday expanded beyond a single day into a weekend-long event. This is where we see the introduction of Small Business Saturday and Cyber Monday to accommodate diverse consumer preferences.
Today, Black Friday is a cultural phenomenon that has spread beyond the US, to many countries around the world. Though, much of its impact is felt online. In 2022 online shoppers spent $19.2 billion on Black Friday, an increase of 2.3% over 2021.
With this rise in digital presence, it’s never been more important to measure how well Black Friday campaigns perform. That’s why data and its analysis are so crucial.
What to do before Black Friday
The key to any successful analysis of a campaign is to ensure you’ve prepared properly. You can’t analyse data you don’t have, so keep the following in mind as you plan your campaigns.
- Define clear objectives and goals: Clearly define the key objectives, such as sales targets, customer acquisition goals, or promotion effectiveness.
- Set your key performance indicators (KPIs): Identify the KPIs that align with your objectives, such as conversion rates, average order value, customer engagement metrics, and website traffic.
- Implement tracking systems: This doesn’t have to be complex- think Google Analytics tracking code, UTMs, etc. And make sure you test the tracking of any campaign you set up.
- Develop a comprehensive marketing strategy: Plan a multichannel marketing strategy, including online platforms, social media, email marketing, and in-store promotions. Create compelling content and promotional materials tailored to your target audience.
- Collaborate: Foster collaboration between marketing, sales, customer support, and IT teams. Ensure clear communication channels and alignment on campaign goals and strategies.
- Plan for data collection and analysis: Develop a comprehensive plan for collecting data during the Black Friday campaign. Outline the analysis methods and tools that will be used for post-campaign evaluation.
Key metrics for post-Black Friday evaluation
As mentioned above, one of the most important parts of any successful Black Friday evaluation is the KPIs. These metrics provide a granular view of different aspects of your campaign and customer interactions.
Sales performance metrics
- Total sales: Evaluate the overall sales figures during the Black Friday period compared to previous benchmarks.
- Product-specific sales: Identify the top-performing products and categories.
- Conversion rates: Analyze the percentage of website visitors who made a purchase.
Customer engagement metrics
- Website traffic: Examine the increase or decrease in website visits during the campaign.
- Social media reach: Measure the reach and engagement of your social media posts related to Black Friday.
- Email open and clickthrough rates: Assess the effectiveness of your email campaigns.
Operational metrics
- Checkout abandonment rate: Identify the percentage of users who added items to their cart but did not complete the purchase.
- Website uptime: Ensure that your website remains operational without significant downtime.
Customer satisfaction metrics
- Return rates: Evaluate the number of returns post-Black Friday.
- Customer feedback and reviews: Collect feedback from customers and review platforms to gauge satisfaction.

Tools for effective data collection and analysis
Once you’re armed with an understanding of the critical metrics, the next step is to leverage tools that facilitate seamless data collection and analysis. There are several options here, and it will depend on your tech stack, but here are a few options that will provide you with a good starting point.
Google Analytics
GA provides an overview of the performance of your website. You track everything from traffic to conversions if you set it up correctly. While it can be a little complex initially, it is a free tool with great documentation and training opportunities.
CRM analytics
Most customer relationship management tools (CRMs) come with built-in analysis functionality. For example, HubSpot has comprehensive reporting options. This will allow you track your progress on a contact level, as well as at a campaign level to see where the most valuable customers come from.
Dashboard tools
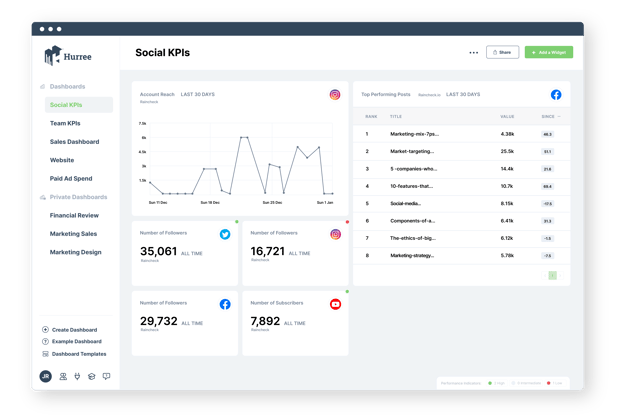
One of the most frustrating aspects of post-campaign analysis is that data can often be held in different apps and platforms, which can be very time-consuming to manage. While you may have customer data in your CRM, your social media campaign data may only be available in the social media app itself. Dashboard tools, like Hurree, allow you to bring all of your data into one place. You can customise your dashboards according to your preference - track by channel, campaign, or even post.
Refining strategies for future campaigns
So you’ve taken all the right steps and you now have a wealth of data at your disposal, the final step is to translate insights into actionable strategies for future campaigns. But how do you do that?
Identify success patterns
Product preference: Identify patterns in customer preferences to tailor future product offerings.
Effective marketing channels: What are the channels that yielded the highest engagement and conversions?
Address challenges proactively
Checkout process optimisation: If checkout abandonment was an issue, optimize the process for smoother transactions.
Customer service enhancement: Address any challenges highlighted in customer feedback to enhance service.
Personalization and targeting
Tailored offers: Use customer data to create personalized offers for future campaigns.
Segmented marketing: Refine audience segments based on Black Friday insights for more targeted marketing.
In the ever-evolving landscape of marketing, post-campaign analysis is not just a retrospective; it's a foundation for future success. With data-driven insights from your Black Friday campaign, you have the tools to refine strategies, enhance customer experiences, and propel your marketing efforts to new heights. As the next Black Friday approaches, the lessons learned this year will be the stepping stones to a more successful future.


Share this

6 Benefits of Centralizing your Marketing Data

10 Effective Marketing Strategies For Business Growth