Google is known for many things, but anyone who runs a website knows that it likes to make big changes in the name of customer satisfaction. Their algorithm updates in particular have caused marketers no short amount of stress.
One of their biggest upcoming changes is not to their notorious algorithm, however, it’s to their Analytics platform. Google is sunsetting its current iteration of Analytics, Universal Analytics, in favour of Google Analytics 4.
What does this mean for website owners? How will this affect you? And most importantly, how do you make the switch over to GA4? We’ve put together this guide to help make the transition as smooth and pain-free as possible.
Table of contents
- What is GA4?
- The differences between GA4 and Universal Analytics
- Differences between metrics in GA4 and Universal Analytics
- GA4 Metrics and Terminology
- How to back up data from Universal Analytics
- How to migrate from Universal Analytics to GA4
- How to streamline your GA4 reports
What is GA4?
Before we go over how to migrate your data to Google’s new platform, we should go over what exactly it is and why you should care.
Google Analytics 4, also known as GA4, is the latest version of Google's web analytics tool. It's designed to help website owners understand how people interact with their sites and apps, and use that information to improve their user experience and drive more conversions.
In simple terms, GA4 tracks and collects data about visitors to a website or app, and then presents that data in a variety of reports and visualizations that can be used to understand things like where visitors are coming from, what pages they're looking at, and how they're interacting with the site.
Some of the main features of GA4 include:
- Cross-device and cross-platform tracking: GA4 can track user activity across different devices and platforms, including web and mobile apps, so you can see how users are interacting with your brand across different touchpoints.
- Event-based tracking: GA4 tracks events, or specific actions that users take on your website or app, such as clicking a button or filling out a form. This allows you to see how users are interacting with your site and identify areas that need improvement.
- Machine Learning: GA4 includes machine learning capabilities that can help you understand user behaviour, identify patterns and find insights that would be difficult to detect manually.
- Integration with other tools: GA4 can be integrated with other Google tools, such as Google Ads, Google BigQuery and Google Cloud Storage, allowing you to see how your advertising campaigns and other initiatives are impacting your website's performance.

The differences between GA4 and Universal Analytics
GA4 becomes Google Analytics’ only option in July 2023, when it replaces the current version of GA known as Universal Analytics (UA). We’ll go through GA4 features and metrics in depth below, but it is helpful to know what the differences are between the two platforms and why Google is making such an enormous change.
Data Model
One key difference is that GA4 uses a different data model than UA. The current model of analytics is based on user sessions (hits on a website within a certain timeframe) and pageviews. This model is almost 15 years old and relies on older data collection methods like cookies. Under these parameters, an individual user viewing a site on different devices is technically counted as multiple users.
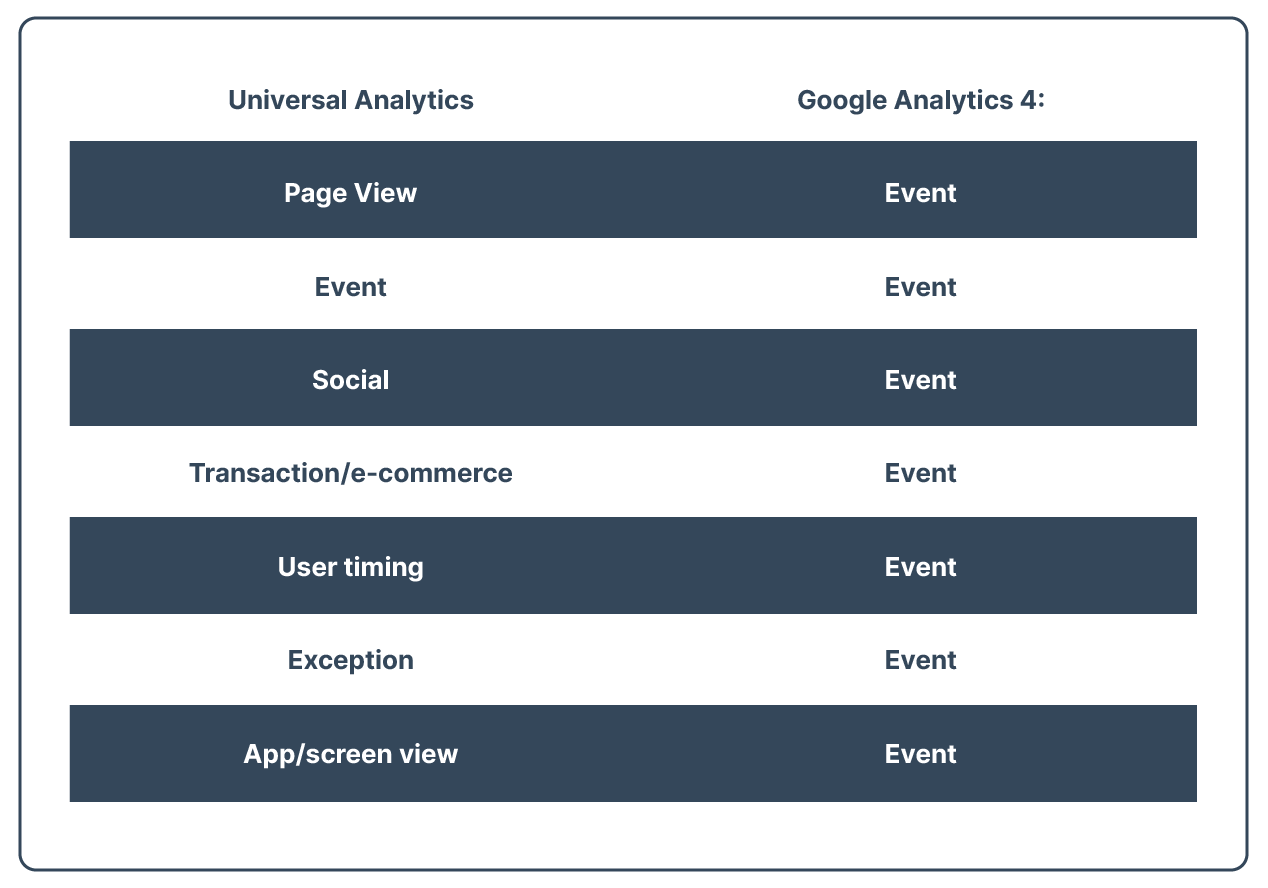
GA4, on the other hand, bases their performance measurement on events and parameters. What does that mean? Well, all the different hit types we’re used to in UA - including page views, social interactions, and even transactional information - are counted as an event in GA4, and then each of these events will contain parameters (rather than labels and categories). Google claims this method will be more customer-centric, measuring user interaction and deduplicating the data for your users across their different devices and apps.
Advanced analysis
This new data model means that GA4 is capable of more advanced analysis than UA. Currently, UA allows you to create custom reports using secondary dimensions to provide a decent level of insight.
GA4 takes it further with Exploration reports. The best way to acquaint yourself with the elements of Exploration is to go directly to GA4, but they include different dimensions, segments, and metrics that you can add to customise your reports.
This also means that GA4 is customisable - much more so than UA, largely because of its data model, which we’ve already discussed, and its reporting interface.
Reporting interface
With the advanced analytics capabilities comes an improved reporting interface that is meant to provide a more intuitive and user-friendly way to access and analyze data. Most of the reports you’re used to in UA have either been renamed or replaced.
Some of the new reports available in GA4 include:
- Conversion Probability: GA4 uses machine learning to predict the likelihood that a user will convert, based on their behaviour on your site.
- Customer Lifetime Value: GA4 provides insights into the estimated value a customer brings to your business over the course of their relationship.
- Cross-device and cross-platform reports: GA4 provides a more integrated approach to cross-device and cross-platform measurement, allowing you to see how users interact with your business across multiple devices and platforms.
- Event-based reports: GA4 provides a more flexible and granular approach to event tracking, allowing you to see how user interactions with specific elements on your site or app are impacting your business.
- Real-time reports: GA4 provides real-time reporting for a more immediate understanding of what's happening on your site or app.
- Flow reports: GA4 provides flow reports to help you visualize the paths users take through your site or app, including where they drop off and what actions they take along the way.
These new reports are designed to provide a more complete understanding of user behaviour and to help businesses make data-driven decisions that improve their online presence and user experience.
Privacy
GA4 has a different privacy model than UA due to the changing landscape of data privacy regulations and user expectations.
UA predominantly operates on a first-party cookie model, where data is collected and stored on a user's device in the form of cookies. This data is then transmitted to Google's servers for processing and analysis.
GA4, on the other hand, operates on a device-based identifier model, where data is collected and processed directly on the device, without the use of cookies. This approach provides a more privacy-centric model, as it limits the amount of data transmitted to Google's servers and reduces the potential for data misuse.
Additionally, GA4 provides features that allow for greater control over data collection and processing, including the ability to enable or disable data collection for individual events, and to configure data retention settings.
Overall, GA4 offers a more privacy-focused approach compared to UA and is better suited to meet the requirements of new data privacy regulations, such as the European Union's General Data Protection Regulation (GDPR).
Differences between Metrics in GA4 and Universal Analytics
We’ve already discussed how GA4 uses events as its main method of measurement, rather than the current sessions and pageviews in UA.
We’ll go over GA4 metrics and terminology in detail below, but one of the main differences in the metrics between the two systems is the introduction of three new ones in GA4.
- Engaged sessions: according to Google, this is the count of sessions that lasted longer than 10 seconds, had a conversion event or had 2 or more screen page views.
- Average engagement time per session: this is the amount of time the user is engaging with the page (scrolling, clicking, etc.) with the primary window being viewed on the screen.
- Engagement rate: This is the ratio of engaged sessions (as above) relative to the total number of sessions in that time period. For example, if you had 2000 sessions and 200 of them were engaged, the engagement rate would be 10%.
These new GA4 metrics aim to provide a more in-depth view of audience engagement, and they will replace UA metrics like average session duration, pages per session, and bounce rate. It may take a bit of time to get used to the lack of bounce rate - it requires a shift in thinking, looking at the positive steps people are taking on a site, rather than the negative.
GA4 Metrics and Terminology
Differences Between Dimensions and Metrics
Google Analytics reports are made up of both dimensions and metrics. Like most reports, metrics are generally quantitative measurements of data, and dimensions are the labels used to describe each piece of data. So for example, a dimension in your report might be a demographic attribute such as age, gender, interest or user information such as first visit date, first purchase date or last active date.
Metrics, on the other hand, are numerical measurements such as averages, ratios or percentages, so, for example, they could be ad clicks, the number of adds to carts, checkouts, purchases or refunds. In Google Analytics 4, you will see both dimensions and metrics. The easiest way to distinguish between them is to recognise that any numerical values will be metrics, and labels, characteristics, parameters, attributes or descriptions will be dimensions. Another way to tell them apart is because the dimensions will be represented in rows (usually on the left-hand side of each table of data) and the metrics will be the columns (going from left to right).
Default Metrics in Google Analytics 4
The metrics in GA4 can be generally grouped into two categories: Default metrics and custom metrics. Default metrics are the ones that will automatically populate within your reports and can be measured straight away, without having to set up anything. Examples of default metrics include:
- Average session duration
- Engaged sessions
- Total revenue
- Engagement rate
- Conversions
Within default metrics, there are subcategories used to group each set of default metrics. These include:
- Acquisition metrics
- Engagement metrics
- Monetization metrics
- Retention metrics
- Demographic metrics
- Tech metrics
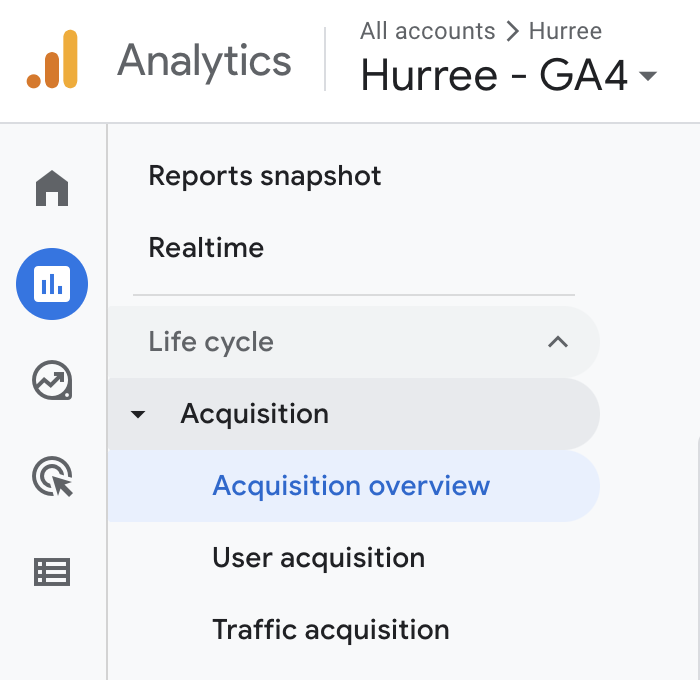
Acquisition metrics
Within this section, you will have the option to view an acquisition overview, user acquisition and traffic acquisition. The user acquisition allows you to understand how users who have never visited your website before have actually found your site, and the traffic acquisition helps you determine what led new and returning users for a new session.
Within this section, you will see your data displayed in a line chart which shows the number of new users per channel group over a specific period of time. You will also see a bar chart that shows the number of new users per channel group and a data table showing the following dimensions:
- First user campaign
- First user default channel group
- First user medium
- First user source
- First user source/medium
- First user source platform
- First user Google Ads ad group name
- First user Google Ads ad network type
And the following default metrics will be included in the table:
- Average engagement time per session
- Conversions
- Engaged sessions
- Engaged sessions per user
- Engagement rate
- Event count
- New users
- Total revenue
- Users
Engagement metrics
This section is used to determine how engaged your users are and measures each engagement dimension including:
- Views
- Users
- New users
- Views per user
- Average engagement time
The engagement metrics section provides the following four reports:
- Engagement overview - shows an overview of engagement such as average engagement time, engaged sessions per user, users in the last 30 minutes, number of views and views by page title, user stickiness etc.
- Events report - This breaks down specific events like page view, first visit, scroll, clicks, file downloads by total number, total user, and number per user and is presented by line graph, bar chart and table.
- Conversions report - This highlights specific conversions by event name in the form of a bar chart, line graph and table.
- Pages and screens report - Line graph, bar chart and table breaking down specific pages by number of views, users, views per user, average engagement time etc.
- Landing page report - Line graph and table showing sessions, users, new users etc to specific landing pages.
Monetization metrics
This report section will display details about ecommerce, subscription and ad revenue. It allows you to see how much money you’re generating and allows you to track each revenue source.
Like the previous reports, there is an overview section alongside:
- Engagement overview - shows an overview of engagement such as average engagement time, engaged sessions per user, users in the last 30 minutes, number of views and views by page title, user stickiness etc.
- Events report - This breaks down specific events like page view, first visit, scroll, clicks, file downloads by total number, total user, and number per user and is presented by line graph, bar chart and table.
- Conversions report - This highlights specific conversions by event name in the form of a bar chart, line graph and table.
- Pages and screens report - Line graph, bar chart and table breaking down specific pages by number of views, users, views per user, average engagement time etc.
- Landing page report - Line graph and table showing sessions, users, new users etc to specific landing pages.
Retention metrics
This section gives insights regarding new and returning users, user retention by cohort, user engagement by cohort and lifetime value, all displayed in line graphs showing change over selected periods of time.
Demographics metrics
In this reporting section, you will have the option to view an overview report or a more detailed report. You can see the breakdown of new users and returning users based on:
- Country
- City
- Gender
- Interests
- Age
- Language
Within the detailed report section, you will have a line graph, bar chart and table showing a more granular view of users’ demographics, and more specifics about new and existing users including engagement metrics, conversion rates, revenue etc.
Tech metrics
Like demographics, there will be an overview report and a detailed report. Tech reports are the metrics used to assess the performance of several tech dimensions including browser, device category, operating system and platform. The overview provides details on users by browser, device category, screen resolution, app version, device model etc. Within the detailed report section, you will see a line graph, a bar chart and a table showing detail on which browser people are using and the engagement rate for each.
Custom Metrics in Google Analytics 4
Although Google Analytics 4 has many highly useful default metrics, there are some times when custom metrics are required. These are user-defined metrics that aren’t automatically tracked so they need to be created manually based on what you want to measure.
To create custom metrics, click admin (the settings cog) > custom definitions > custom metrics > click create custom metrics.
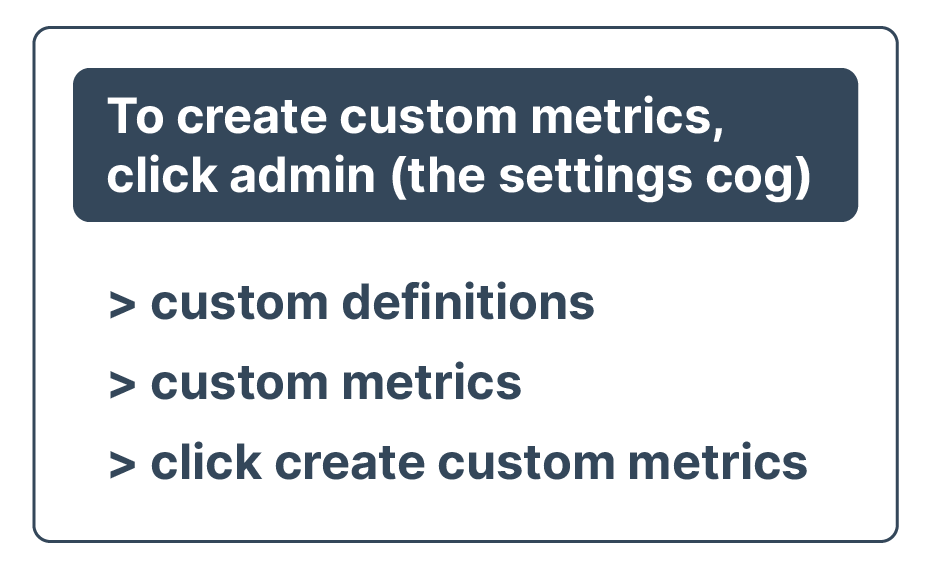
You will then be given the option to name your metric, provide an optional description, and set an event parameter and unit of measurement. Some examples of custom metrics include number of video views, number of form submissions, and total discounted amount of purchases.
How to Back Up Data from Universal Analytics
Backing up your data from UA is a fairly simple process and won’t take you much time. Google provides a way to export raw data through the Google Analytics User Interface as well as via API. The most common method includes exporting your data to a spreadsheet or other supported document type.
How to export to a spreadsheet:
This option allows you to download the data in a CSV format, which can be easily stored or imported into another platform. To export data:
- Go to the Google Analytics dashboard for your property
- Select the view you want to export data from
- Click “Export”
- Choose "CSV" as the export format
- Choose the date range for the data you want to export
- Select the metrics and dimensions you want to include in the export
- Click the "Export" button again to download the data
The other option for backing up data from UA is to use the Google Analytics API. This option provides programmatic access to your Google Analytics data, allowing you to write custom scripts to retrieve and store your data. To use the API:
- Go to the Google API Console
- Create a project and enable the Google Analytics API
- Obtain API credentials (Client ID, Client Secret, etc.)
- Use one of the Google Analytics API client libraries to access your data and retrieve the information you want to back up. You will need to use the appropriate API method and specify the view or views you want to retrieve data from
- Store the data you retrieve in a secure location
How to migrate from Universal Analytics to GA4
1. Create a GA4 property
If you haven’t already, it’s important that you have a GA4 property set up ASAP. You won’t be able to import all historical data from UA, so you want as much information in your GA4 property as possible.
This step involves two elements:
- Creating the GA4 property
- Adding the GA4 tag to your site for tracking
There are a number of ways to do this, but Google has made it easy with Google Tag Manager.
2. Audit your UA property
To properly migrate over to GA4, you need to know how your UA is configured. As discussed above, GA4 has different metrics and properties from UA, so it’s a good idea to know what tracking items you’re currently using.
Common items include (but aren’t limited to):
- Goals/Conversions
- Events
- Bounce rate
- Sessions
- Conversion rate
Once you have listed out what you’re actually tracking, you can decide whether you want to keep them all or cull them. It will also help identify any gaps you have. And don’t forget, you’ll want to do this for all of the different reporting views you have in UA.
3. Map your UA custom dimensions and metrics to GA4 events
You’ve set up your tracking tag and united your UA set-up. The next step is to actually set-up your GA4 and create custom dashboards. Based on the data you put together in step 2, you can start adding individual items to your reporting views.
The items you’ll want to focus on setting up are:
- Events: GA4 includes automated goals (check the nav for Configure). If you need to add any more, you can do that manually.
- Conversions: these were previously goals. There are a number of different types, but event-based goals are a good place to start, then you can move onto the other types.
- Content groupings: this used to be part of the UA interface, but it’s not in GA4. It’s a time-consuming process, which is outlined in this guide from Google.
- Audiences: For details on how to set up audiences, Google has an audience creation guide. This is an important step as it will help with Google Ads campaigns.
- Custom dimensions: This is another element that requires some time and investment to set up. Google has a guide to walk you through it.
This also includes connecting your GA4 account to your other Google properties like Google Ads.
4. Verify that data is being collected correctly in your GA4 property
Once you have everything set up and looking how you want it, make sure that the data is actually tracking properly.
Pro tip: There may be a bit of a difference between GA4 and UA data due to the measurement and data model differences discussed earlier.
Note: The migration process may differ based on the complexity of your UA setup, so you may want to consult a developer or a certified GA consultant to ensure a smooth transition.
Streamline your GA4 reporting with Hurree
GA4 is a complex but important tool. However, even once it is properly set up, monitoring the data and creating reports within the property is not that easy or intuitive. We’ve gone over the sheer amount of data GA4 can analyse, and unless you’re working in GA4 every day, it may not be the best tool for reporting on all of the data it collects.
You need access to your information in a form that is easily understandable and shareable. Dashboard software like Hurree can really help make sense of all the data GA4 provides. Building simple, shareable dashboards is as easy as connecting your account and choosing your data points. Even better, you can use Hurree to compare data from GA4 with all the other tools in your tech stack so that you know exactly what’s going on across your business.
If you’re ready to check out our GA4 integration and all the other platforms you can connect, create a free account now.
Additional reporting by: Ashleigh McCabe


Share this

[Video] Benefits of Market Segmentation Analytics: The Proof is in the Data

12 KPIs to Include in your Sales Analytics Dashboard