Segmentation is a marketer’s best friend. Did you know that campaigns that are segmented based on users’ behaviour have a unique open rate that’s 12.23% higher than unsegmented campaigns?
Long gone are the days where brands and marketers would have to guess the needs of consumers. Big data has changed that. Now we are able to gather consumer data in huge volumes and analyse it to build bespoke, valuable, engaging content that sees brands connect with consumers on a more personal level.

Before we go any further, let’s rewind and clarify...
What is market segmentation?
Market segmentation is essentially the process of dividing and creating subsets or groups of users based on commonalities and identifying characteristics. There are (generally) four different types of market segmentation, such as...
-
Behavioural Segmentation
In this blog, we're going to look at behavioural segmentation with a couple of examples from the big dogs in branding. For B2B teams, firmographic segmentation also plays a complementary role, grouping organisations rather than individuals.
But first, what is behavioural segmentation?
Well, as the name states, behavioural segmentation entails dividing and grouping consumers based on their behaviour. Behaviour counts for both online and offline actions, but in this blog, we will mostly focus on digital behaviour, so let’s take a look.
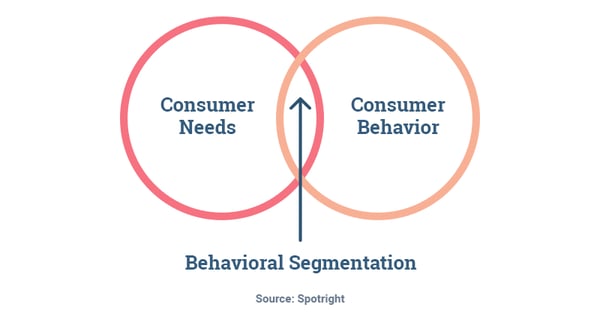 Behavioural segmentation, in the digital world, means segmenting users based on their online actions, i.e. behaviour on a website or app. This normally includes things like the amount of time they spend on your website, or 'dwell time', bounce rate, whether they're new or returning users, how frequently they interact with your brand, which items are looked at or added to their basket or playlist, and this list goes on. Behavioural segmentation does what it says on the tin, and it's an essential tool for marketers in all fields.
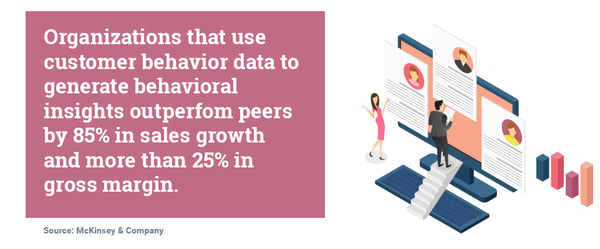
Did you know that organisations that use customer behaviour data to generate behavioural insights outperform peers by 85% in sales growth and more than 25% in gross margin? You can't ignore those statistics.
The 4 core types of behavioural segmentation
Behavioural segmentation splits into four primary sub-types, each grouping customers by a different aspect of what they do:
- Purchase behaviour: How customers act at the point of sale, impulse buying, considered buying, deal-seeking, or brand-loyal purchasing patterns.
- Occasion or timing-based: When customers buy or engage, seasonal purchases, holidays, life events, payday cycles, or habitual time-of-day patterns.
- Benefit sought: What customers are actually looking for when they buy, quality, convenience, price, status, or a specific feature. Two people buying the same product for different reasons belong in different segments.
- Usage rate and loyalty status: How often customers use the product and how committed they are, heavy users, light users, first-time buyers, loyal repeat customers, and at-risk churners.
Most mature segmentation programmes combine two or more of these sub-types with broader market targeting strategies to build genuinely actionable audiences rather than descriptive groups.
Essential data points for effective behavioural segmentation
Behavioural segmentation only works if the right data feeds into it. The most commonly used signals, roughly in order of accessibility:
- Website and app behaviour: Pages viewed, products browsed, dwell time, scroll depth, cart additions, feature usage, and session frequency.
- Purchase and transaction history: Recency, frequency, monetary value (RFM), product category mix, and average order value.
- Email and CRM engagement: Open rate, click-through rate, reply rate, and email lifecycle stage.
- Social media behaviour: Content engagement patterns, share frequency, comment sentiment, and ad interaction history.
- Customer support interactions: Ticket volume, issue category, resolution satisfaction, and escalation patterns.
- Loyalty and retention signals: Subscription renewals, churn indicators, referral activity, and NPS responses.
Collecting and unifying these signals across tools is one of the biggest practical hurdles teams face, and the reason most organisations need a structured approach to analysing data rather than ad-hoc spreadsheet work.
A (very) brief history of segmentation
Segmentation in marketing has been around for decades. Market segmentation became a part of marketing practice around the 1950s, in the form of demographics, and has continued to grow in use, popularity, and relevance ever since. The 60s and 70s mostly focused on census data, the 80s favoured segmentation based on financial data, and the 1990s embraced psychographic data to the fullest. But it wasn’t until 2000 that marketers’ focus really became dominated by behavioural segmentation.
How did we get so much data and how do we analyse it, though?
The boom in data is a direct result of the internet boom of 1995-2000. This boom saw a massive increase in internet-based companies and startups and including the birth of social media.
However, data-driven segmentation has only been possible on such a large scale since the inclusion of Artificial Intelligence (AI) in marketing. Thanks to AI, marketers are able to deliver more relevant, personalised content that aims to be different for each targeted segment of consumers.
Marketers today are spoilt for choice when it comes to deciding on which segmentation type(s) to use in their strategy. And that’s all thanks to the huge pool of data currently available which, compared to years ago, is unparalleled.
So now that we know what behavioural segmentation is, how it came about and why we use it in the business world, let’s take a look at these 3 case studies: Coca-Cola, Airbnb, and Netflix.
First up is Coca-Cola
Coca-Cola is the largest soft drink company globally and is one of the most recognisable brands in the world. Coke owns a colossal number of other soft drink brands, organises community events, foundations and partnerships. 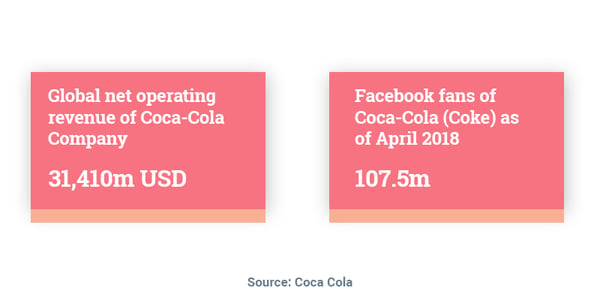
So how does Coke do it? Coca-Cola centre their segmentation strategy on consumer behaviour, both online and offline. The carbonated-conglomerate focus on a number of different aspects when segmenting their customers:
-
Website analytics and social media data analysis
-
Loyalty status - how strong or weak consumers’ loyalty is to Coca-Cola (which tends to be analysed using social data and data gathered from the activity on Coke’s website).
-
Occasions - The most popular occasion for consumers to drink coke - this could refer to seasons, events, or simply meal times.
-
Benefits sought - what consumers are looking for when they purchase the product. This could be the refreshing taste, product uniqueness, the 'vibe' of the brand or its promotional benefits.
Basically, Coke can be seen as an unrivalled market leader. They have truly loyal customers that are likely to never switch to another brand due to their unparalleled love of Coca-Cola. This loyalty is undoubtedly a result of Coke’s impressive marketing strategies. Their utilisation of consumer data allows Coke to behaviourally segment their users. From here they tailor their products, content and messages so accurately, that they now have the luxury of being one of the world’s most recognised brands.

Next, we’re looking at Airbnb
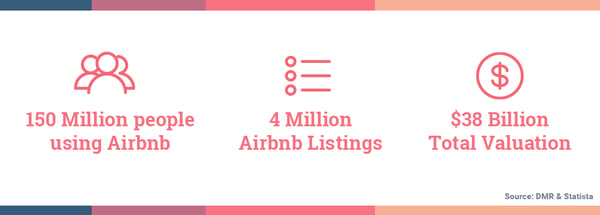
Airbnb is the world’s largest accommodation-sharing site. The concept of paying to stay in a complete stranger's house could be considered odd by some but, nevertheless, Airbnb can proudly say that they’ve made it. They’re super successful. Some of their success can definitely be attributed to innovation, diverse pricing and experiences offered. But business success rarely comes without intelligent marketing strategies, and that’s where Airbnb’s clever segmentation and targeting comes in.
Airbnb uses machine learning to generate insights from user reviews, which are then displayed at the top of their webpage. These insights will likely be one of the first things prospective users see or click on when visiting the site, which will encourage users to book as well as encourage dwell time on Airbnb’s page.
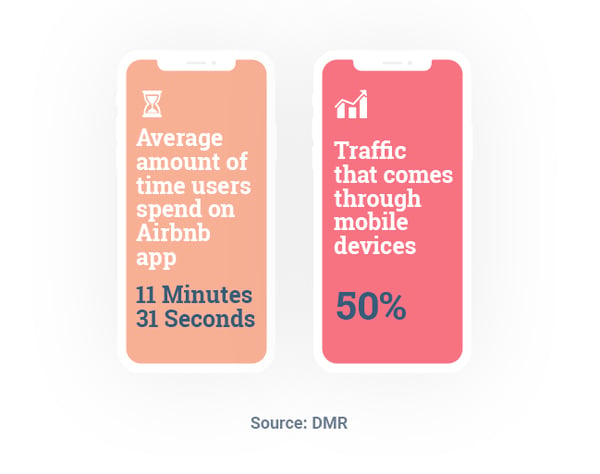
Airbnb also uses consumers’ behavioural data and preferences to essentially pair hosts and guests. They do this by noting the preferences and online behaviour of potential guests and the preferences of the hosts and then produce coefficient listings.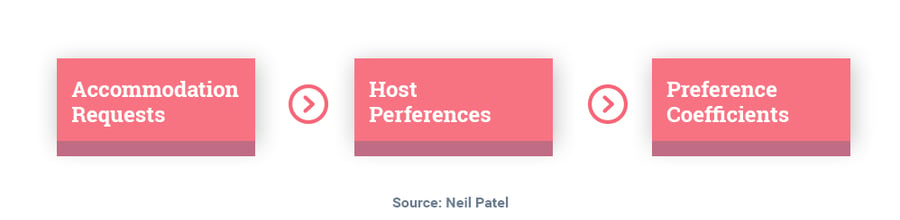
That makes sense, right? But how do they actually do it? Airbnb achieves this ‘perfect match’ with its specialised search algorithm. The algorithm takes and analyses data from both Airbnb hosts and guests and offers matches based on their similarities.
Along with matching via their algorithm, Airbnb use split testing to discover how website changes may affect consumer behaviour. Airbnb goes even further by using cookies, and other tracking-tech, to hold information from previous searches and booking decisions. Then, with this new information, they are able to adjust and personalise the content that users see when browsing the website. That’s not bad for a company that’s only around 10 years old!
And last, but not least, we have Netflix.
Netflix is the world’s leading entertainment streaming service and is arguably the most proficient brand when it comes to behavioural segmentation.
Netflix has got it all sorted: the personalisation efforts begin as soon as a user creates an account with Netflix and streams even just one TV show or movie. Once they do this, Netflix’s behavioural segmentation efforts are clear (and usually welcomed).
So how do they do it? Netflix uses an algorithm that allows them to consistently and accurately A/B test and experiment with viewer preferences. Netflix’s algorithm dictates everything - the homepage layout, the recommended content, and even the visuals, or landing cards, for each piece of cinema. No, I’m not making this up. Netflix actually personalise the image you see based on the actors, actresses or genres that it thinks you like. And it works!
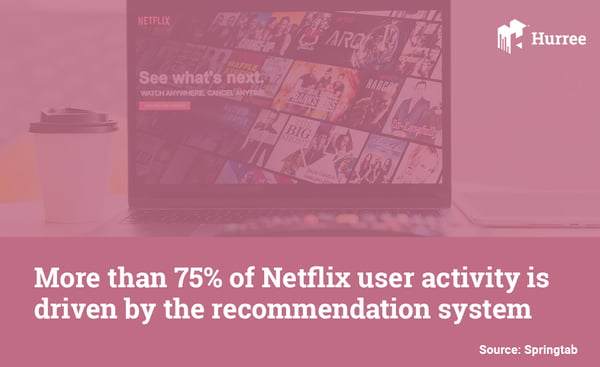
The effort that Netflix has gone to in order to behaviourally segment their subscribers shows how dedicated they are to personalising experiences. Did you know that Netflix's recommendation system saves them a massive $1Billion per year? It’s clear to see, then, how segmentation has helped Netflix succeed so quickly, and why behavioural segmentation is a central part of their marketing strategy.
It’s Netflix’s combination of big data, algorithmic personalisation, and huge content investment that are likely to keep us glued to the screen for the foreseeable future.
Modern tools and technologies for behavioural segmentation
The manual spreadsheet approach to behavioural segmentation has been almost entirely replaced by purpose-built tools. In 2026, teams typically operate across four layers:
|
Layer |
Representative platforms |
What it does for behavioural segmentation |
|---|---|---|
|
Product and web analytics |
GA4, Mixpanel, Amplitude, Heap, Hotjar |
Captures raw behavioural events, page views, clicks, feature usage, scrolls |
|
Customer data platforms (CDPs) |
Segment, mParticle, Tealium, Rudderstack |
Unifies identity across web, mobile, CRM, and offline; builds behavioural segments from unified profiles |
|
Marketing automation and CRM |
HubSpot, Salesforce, Klaviyo, ActiveCampaign |
Triggers segment-specific journeys and messages based on behavioural rules |
|
BI and reporting |
Hurree, Looker, Tableau, Power BI |
Consolidates behavioural segment performance alongside revenue and campaign data in one dashboard |
Small businesses with limited budget can start with GA4 (free) for behavioural events, a CRM with behavioural triggers, and Hurree for consolidated reporting. The principle that matters more than tool choice is that behavioural data flows cleanly from capture to activation, a broken pipeline between analytics and email means segments never reach the customer.
Common challenges in behavioural segmentation
Behavioural segmentation is powerful but comes with distinct practical hurdles:
- Data fragmentation: Behaviour happens across devices, channels, and sessions. Without a unified identity layer, the same customer looks like three different people.
- Privacy and consent constraints: GDPR, CCPA, and iOS tracking restrictions have reduced the behavioural signals available. First-party, consent-based data is now the foundation, third-party cookies are not.
- Over-segmentation: Slicing audiences too finely produces segments too small to act on. Three to six behavioural segments is typical; more than ten usually signals over-engineering.
- Recency bias: Behavioural data captures what customers did last week, not what they will do next. Without predictive modelling, segments over-weight recent actions at the expense of long-term patterns.
- Correlation versus causation: A customer who browsed a product page three times may be interested, or may have landed there by accident. Behavioural signals always need to be validated against outcome data.
- Operational follow-through: Building the segment is only half the job. If the email, ad platform, and sales team cannot activate it, the segment produces no ROI.
For teams uncertain whether their current segments are still serving them, Hurree's checklist of signs you are targeting the wrong market segments is a practical pressure test, and the broader market segmentation strategy checklist provides a structured annual review framework.
KPIs for measuring behavioural segmentation success
To justify investment in behavioural segmentation, tie it to measurable outcomes across four dimensions:
- Segment-level conversion metrics: Conversion rate by segment, revenue per segment, average order value by segment, and lead-to-customer conversion by segment.
- Engagement metrics: Open rate, click-through rate, on-site engagement, and content-consumption depth compared across behavioural segments versus unsegmented cohorts.
- Retention metrics: Churn rate by segment, repeat purchase rate, and customer lifetime value by segment, behavioural segments should outperform unsegmented audiences on all three.
- Efficiency metrics: Cost per acquisition by segment and ROAS by segment, behavioural targeting should reduce waste against broad campaigns.
The clearest signal that behavioural segmentation is working is a widening performance gap between targeted behavioural segments and control cohorts. Tracking these alongside the 40 KPIs most relevant to marketing teams gives the full picture.
Segment by what people do, not who they say they are
Brands such as Amazon also use behavioural segmentation to recommend your products; Spotify analyses users' behaviour to bring you your 'Recommended Daily Mix', and that's just to name a few.
Want to stay relevant to customers? Behavioural segmentation is a perfect way to get there.
And market segmentation is an essential tool in today's data-driven business landscape. In order for brands and businesses to truly understand their user's different and specific requirements, they must rely on valuable data analysis and segmentation. Especially if they want to keep up with the competition. And with constant advancements in technology, it's now possible to gain real, actionable insights from that data that will help you better understand your customers and, in turn, provide them with engaging content and unparalleled experiences.
Frequently asked questions
What is behavioural segmentation in simple terms?
Behavioural segmentation groups customers based on what they actually do, their purchases, browsing patterns, product usage, engagement frequency, and loyalty behaviour, rather than who they are demographically or where they live.
What are the four main types of behavioural segmentation?
Purchase behaviour (how people buy), occasion or timing-based (when they buy), benefit sought (why they buy), and usage rate or loyalty status (how often they buy and how committed they are).
How does behavioural segmentation differ from psychographic segmentation?
Psychographic segmentation explains why customers make decisions, values, attitudes, motivations. Behavioural segmentation captures what customers actually do, clicks, purchases, usage. Psychographics is attitudinal; behavioural is observational. Used together they produce a richer customer view than either alone.
What data do I need for behavioural segmentation?
Web and app analytics (page views, clicks, dwell time), purchase and transaction history (RFM data), email engagement (opens, clicks), social media behaviour, customer support interactions, and loyalty and retention signals. The more unified the data, the more actionable the segments.
What tools are used for behavioural segmentation?
Product analytics (GA4, Mixpanel, Amplitude), CDPs (Segment, mParticle), CRM and marketing automation (HubSpot, Salesforce, Klaviyo), and BI dashboards (Hurree, Looker, Tableau). Small businesses can start with GA4 and a CRM with behavioural triggers.
What are the biggest challenges in behavioural segmentation?
Data fragmentation across channels and devices, privacy and consent constraints (GDPR, iOS), over-segmentation into groups too small to act on, recency bias, confusing correlation with causation, and failure to operationalise segments into campaigns that reach customers.
How do I measure whether behavioural segmentation is working?
Compare segment-level conversion rate, revenue, engagement, retention, and cost-per-acquisition against unsegmented control cohorts. A widening performance gap is the clearest proof of ROI.
Can small businesses use behavioural segmentation?
Yes. Small businesses benefit from even basic behavioural filtering, separating first-time visitors from returning customers, active email engagers from dormant contacts, and high-value purchasers from one-time buyers. Free tools like GA4 and low-cost CRM behavioural triggers make this accessible without enterprise budgets.
How does AI change behavioural segmentation?
AI enables dynamic segments that update in real time, predictive scoring that anticipates future behaviour, and automated personalisation at scale. Segments are no longer static quarterly exercises, they evolve continuously as new behavioural data arrives.
Should behavioural segmentation be used alone or combined with other types?
Almost always combined. Behaviour tells you what customers do; psychographics tells you why; demographics tells you who; firmographics tells you which company. Layering behavioural data with at least one other type produces far more actionable segments.


Share this

Firmographic Segmentation: 7 Essential Elements

What is Psychographic Segmentation: The Basics for Marketers